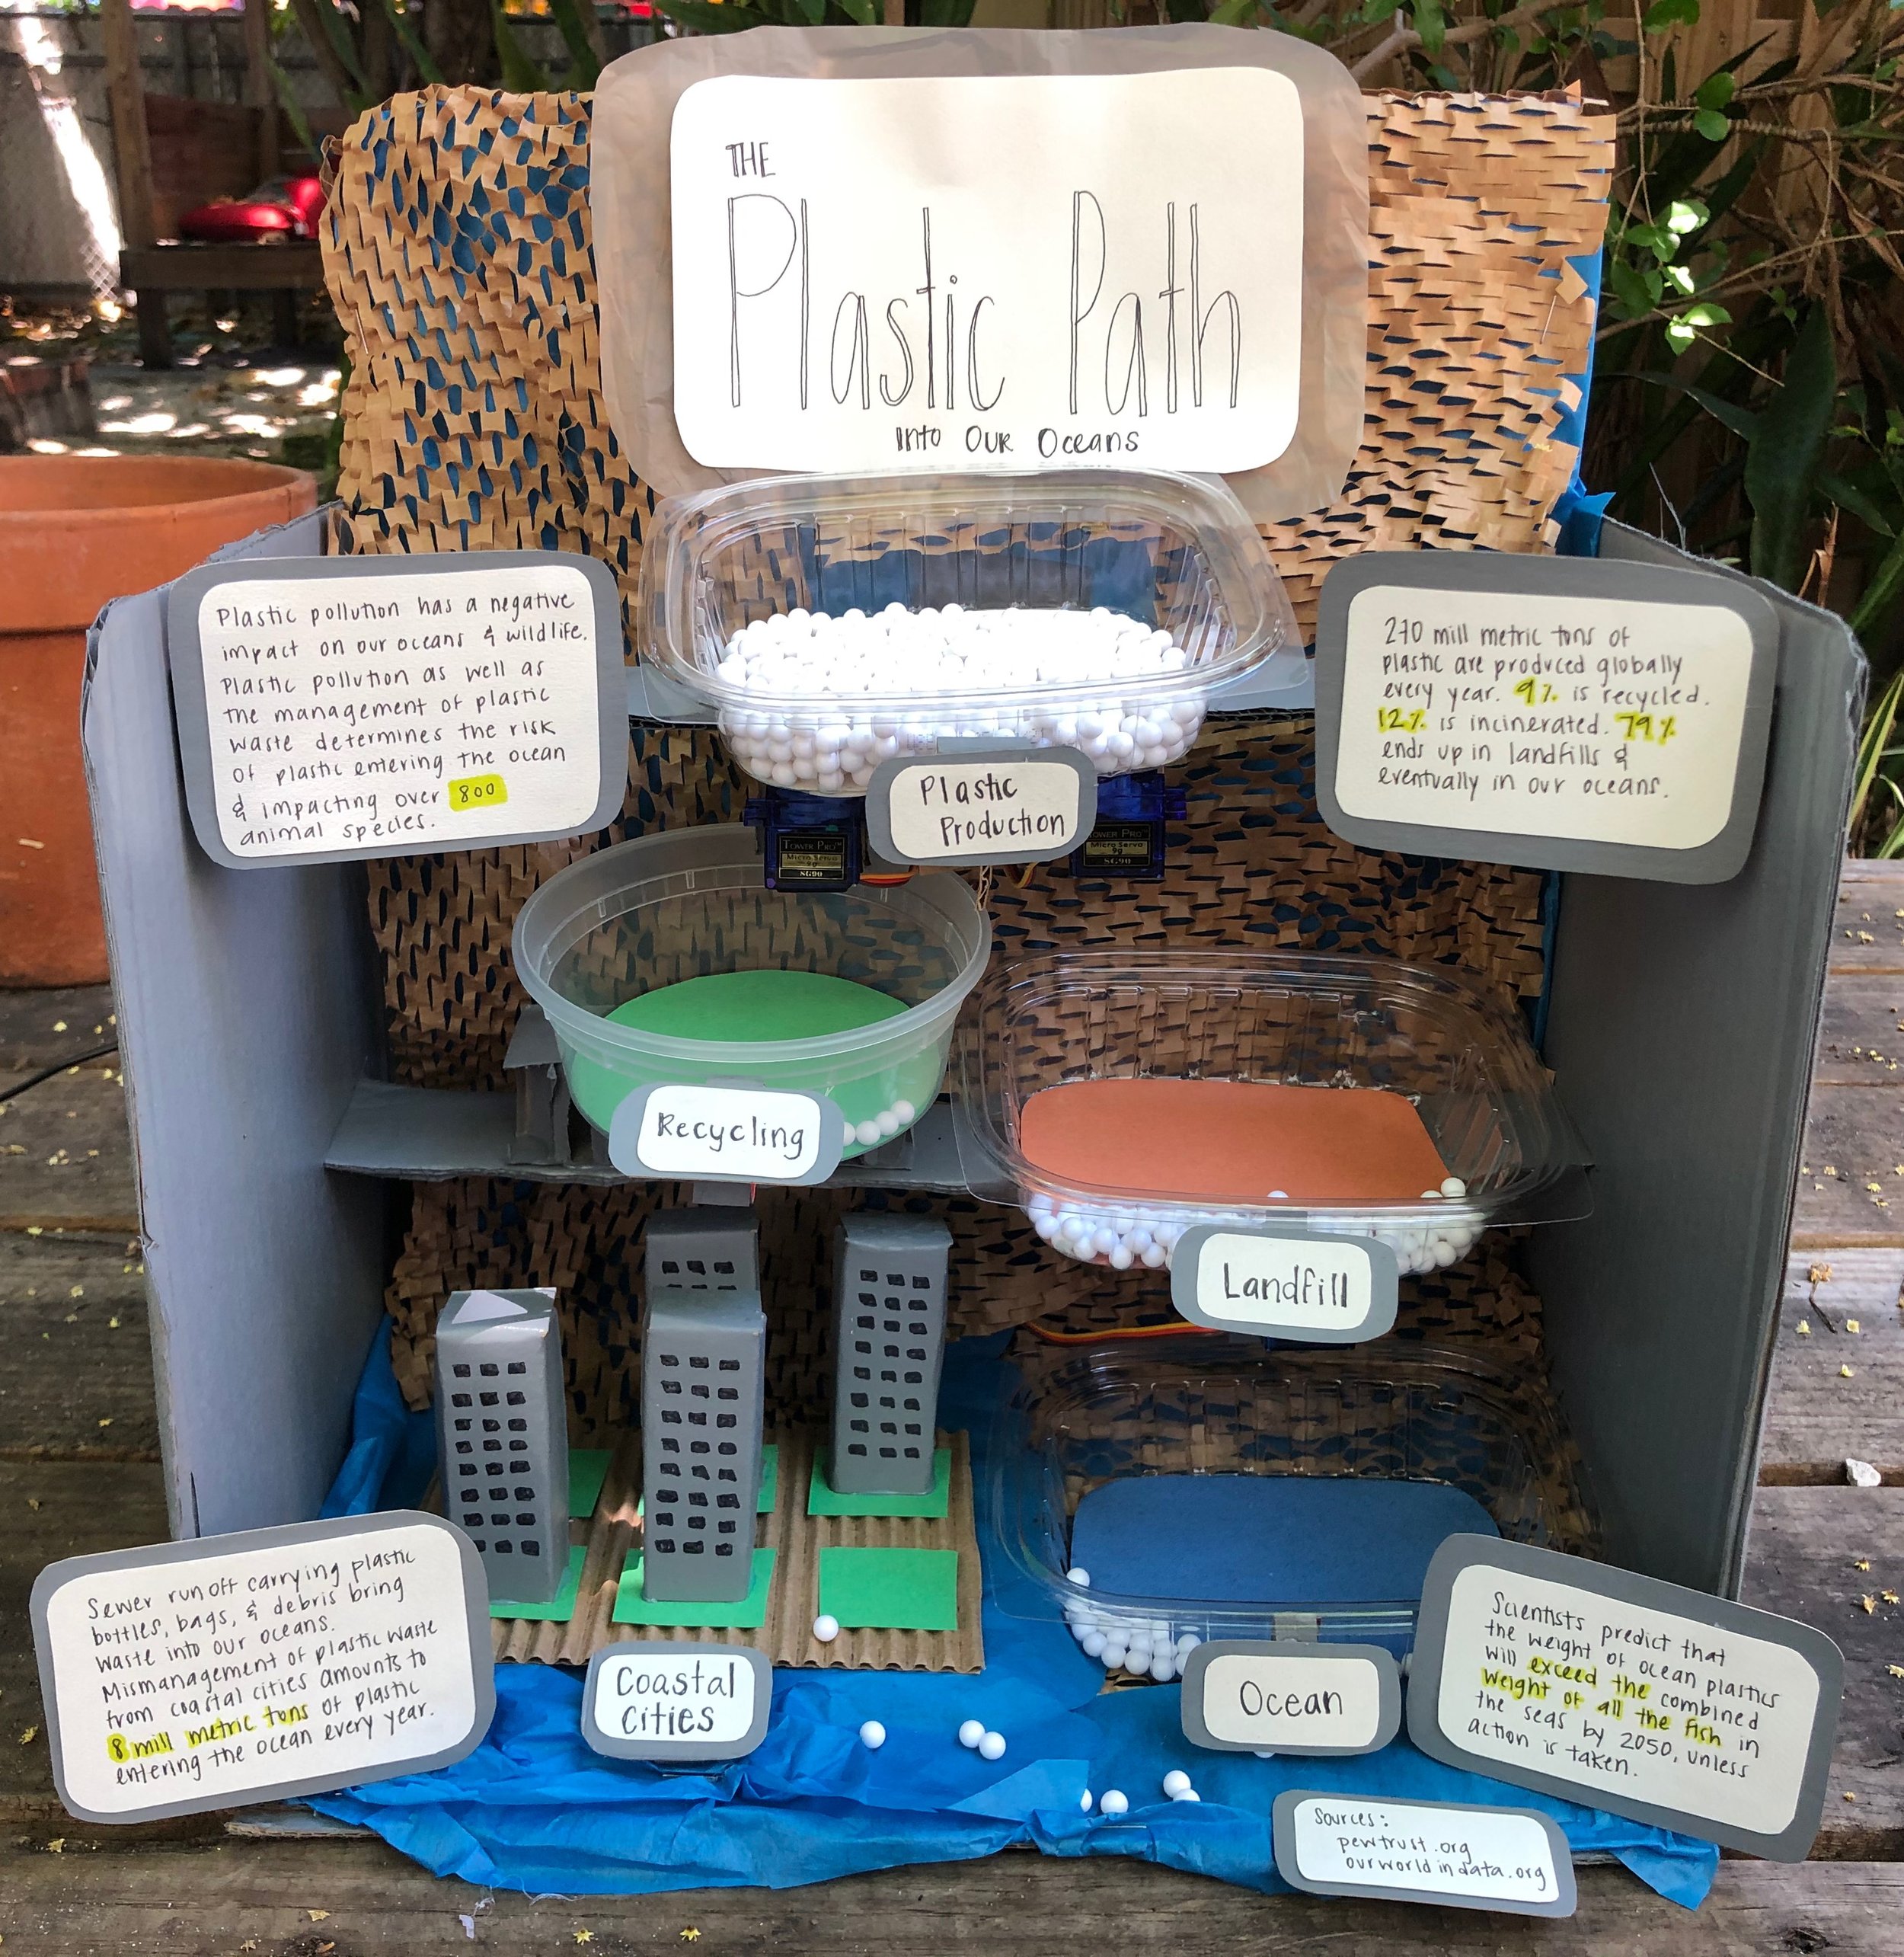
THE PLASTIC PATH INTO OUR OCEANS
A physical data viz demonstrating the flow of plastic from production to ocean
This project won the Physical Computing category at the University of Miami Interactive Media Annual Showcase 2021.
BRIEF
“Create a fun analog interface. Think of a toy, gag, carnival games, musical instruments, etc. Try finding items around that house to help you build your projects.”
CONTEXT | A project for a “Physical Computing” class at the University of Miami.
ROLE | Designer
TIMELINE | 3 Weeks
INSPIRATION | Interactive art displays: The Happy Show and Reactive Sparks
INSPIRATION
From day one, I knew that I wanted to create a physical data viz for this project. I drew inspiration from physical art installations that portrayed data. The first is “The Happy Show,” where part of the installation includes large gum-ball dispensers that allow people to indicate how happy they are, resulting in a bar chart visual.
Image from Stefan Sagmeister’s “The Happy Show”
The next is the the installation, Reactive Sparks which uses waves in multiple LED light displays to represent the amount of traffic on a busy highway in Germany.
Video from Jeff Rainey of Markus Lerner’s “Reactive Sparks”
I also knew I wanted to cover a meaningful topic and spread awareness about an important issue, and so I decided to draw even more inspiration from my life experiences.
DATA TRASH
In January 2020, I had the opportunity to join a team with environmental advocate, Andrew Otazo and push a cart holding 100 pounds of trash collected from Biscayne Bay through the Miami Marathon. Nothing says physical data viz to me more than piles of collected trash. When analyzing a pile of collected trash, you can literally count the items, analyze what kinds of products people used, and make inferences about where they came from and how they ended up there.
Our team representing Miami Water Keeper in January 2020 after walking 26 miles pushing our cart of ocean trash.
I decided to give Andrew a call to dig in more and find out what a data viz representing trash —specifically plastic— could convey.
One of the key takeaways from our conversation was that as a society, we need to be tackling plastic production at the source. Individually, it is important that we all commit to reducing our plastic waste and disposing of one-time-use plastics appropriately. It would be more impactful however, to hold sources of plastic production accountable.
RESEARCH
Digging deeper into the topic, I found a few articles that helped me understand how much plastic there actually is in the ocean as well as the consequences of it.
Here’s an excerpt from the National Geographic:
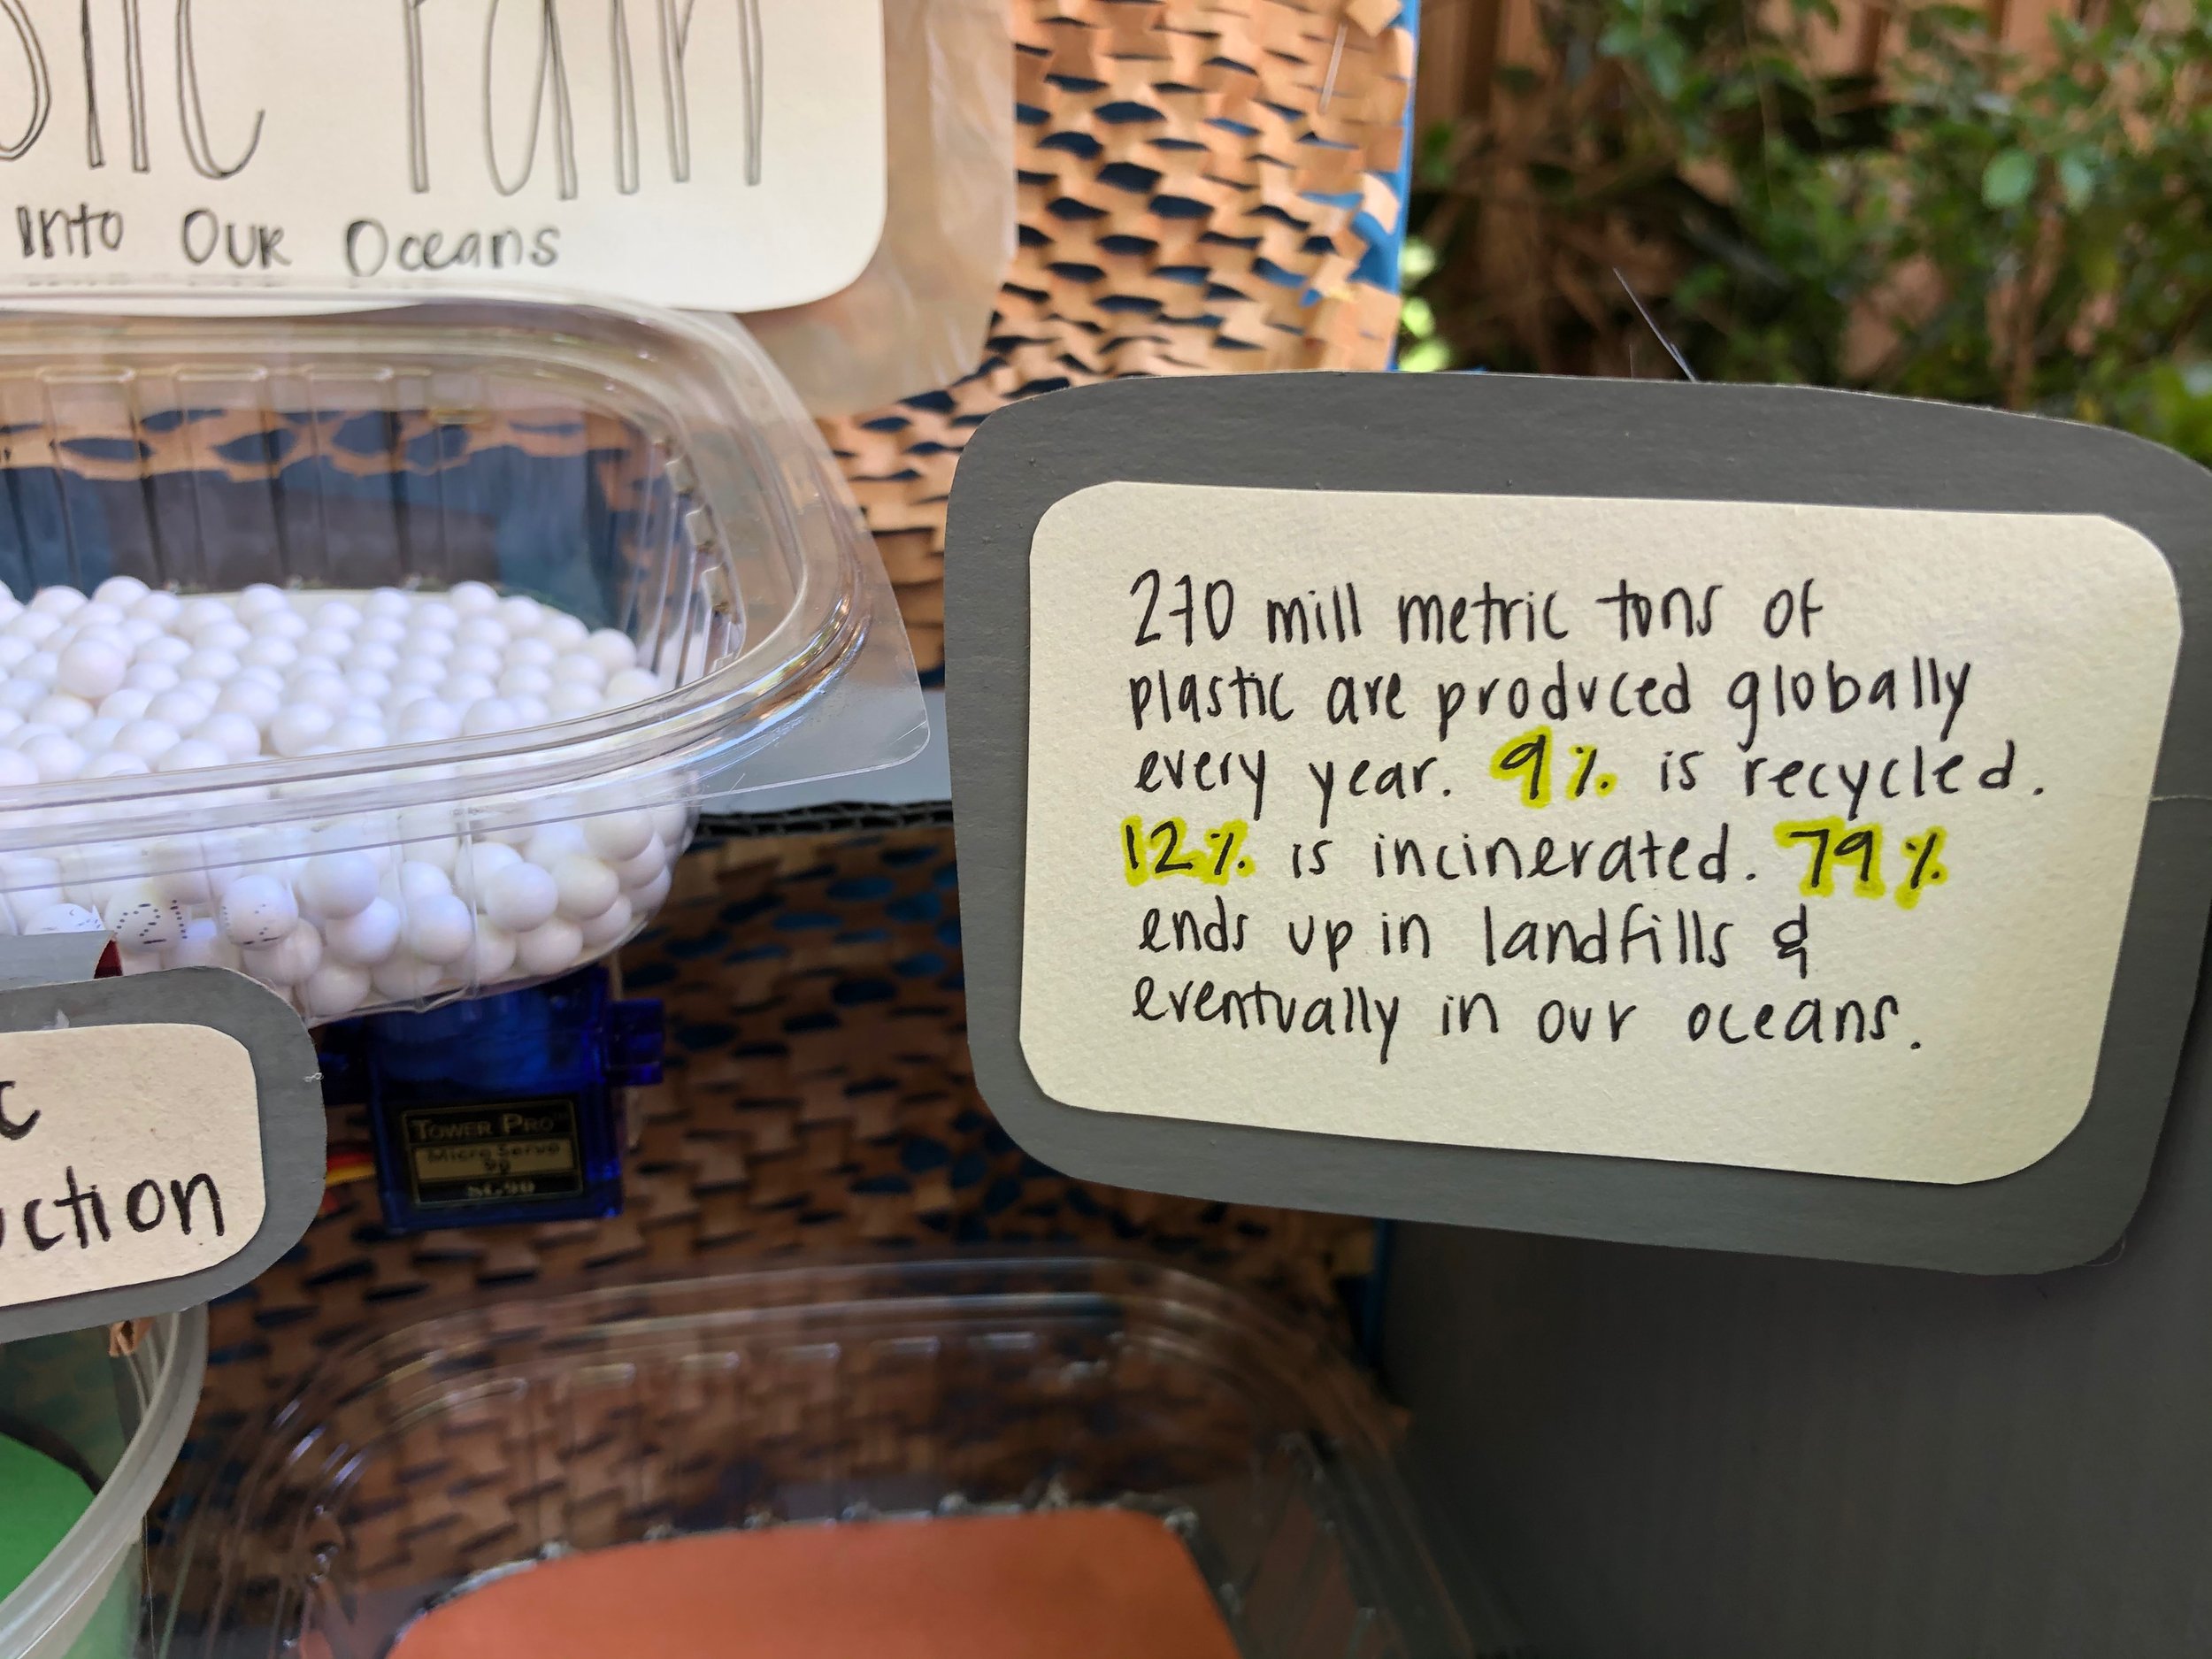
Of our plastic waste, “…Only nine percent has been recycled. The vast majority—79 percent—is accumulating in landfills or sloughing off in the natural environment as litter. Meaning: at some point, much of it ends up in the oceans, the final sink.”
Image from National Geographic
And lastly by these powerful images showing the impact of plastic waste on marine life from Pewtrusts.org.
U.S. Fish and Wildlife Service
Image from Justin Hofman
SKETCH
Based on my conversation with Andrew, I knew that I wanted to create a viz that showed where plastic was coming from and how it ended up in the ocean. Initial brainstorming got me thinking of an hourglass shaped visualization that would filter some type of plastic into respective containers representing recycling, landfill and ocean. My professor suggested Airsoft BBs as the element that would represent plastic as well as using servos to filter the BBs into respective containers.
I came up with the following sketch trying to represent as much of the mechanics as possible and thinking of every physical element that I would need to get the viz to work. Typically I start my sketches with hand drawings, but starting it digitally this time, allowed me to represent 3D aspects of the piece as well as make constant edits as I thought of new elements that I would have to represent.
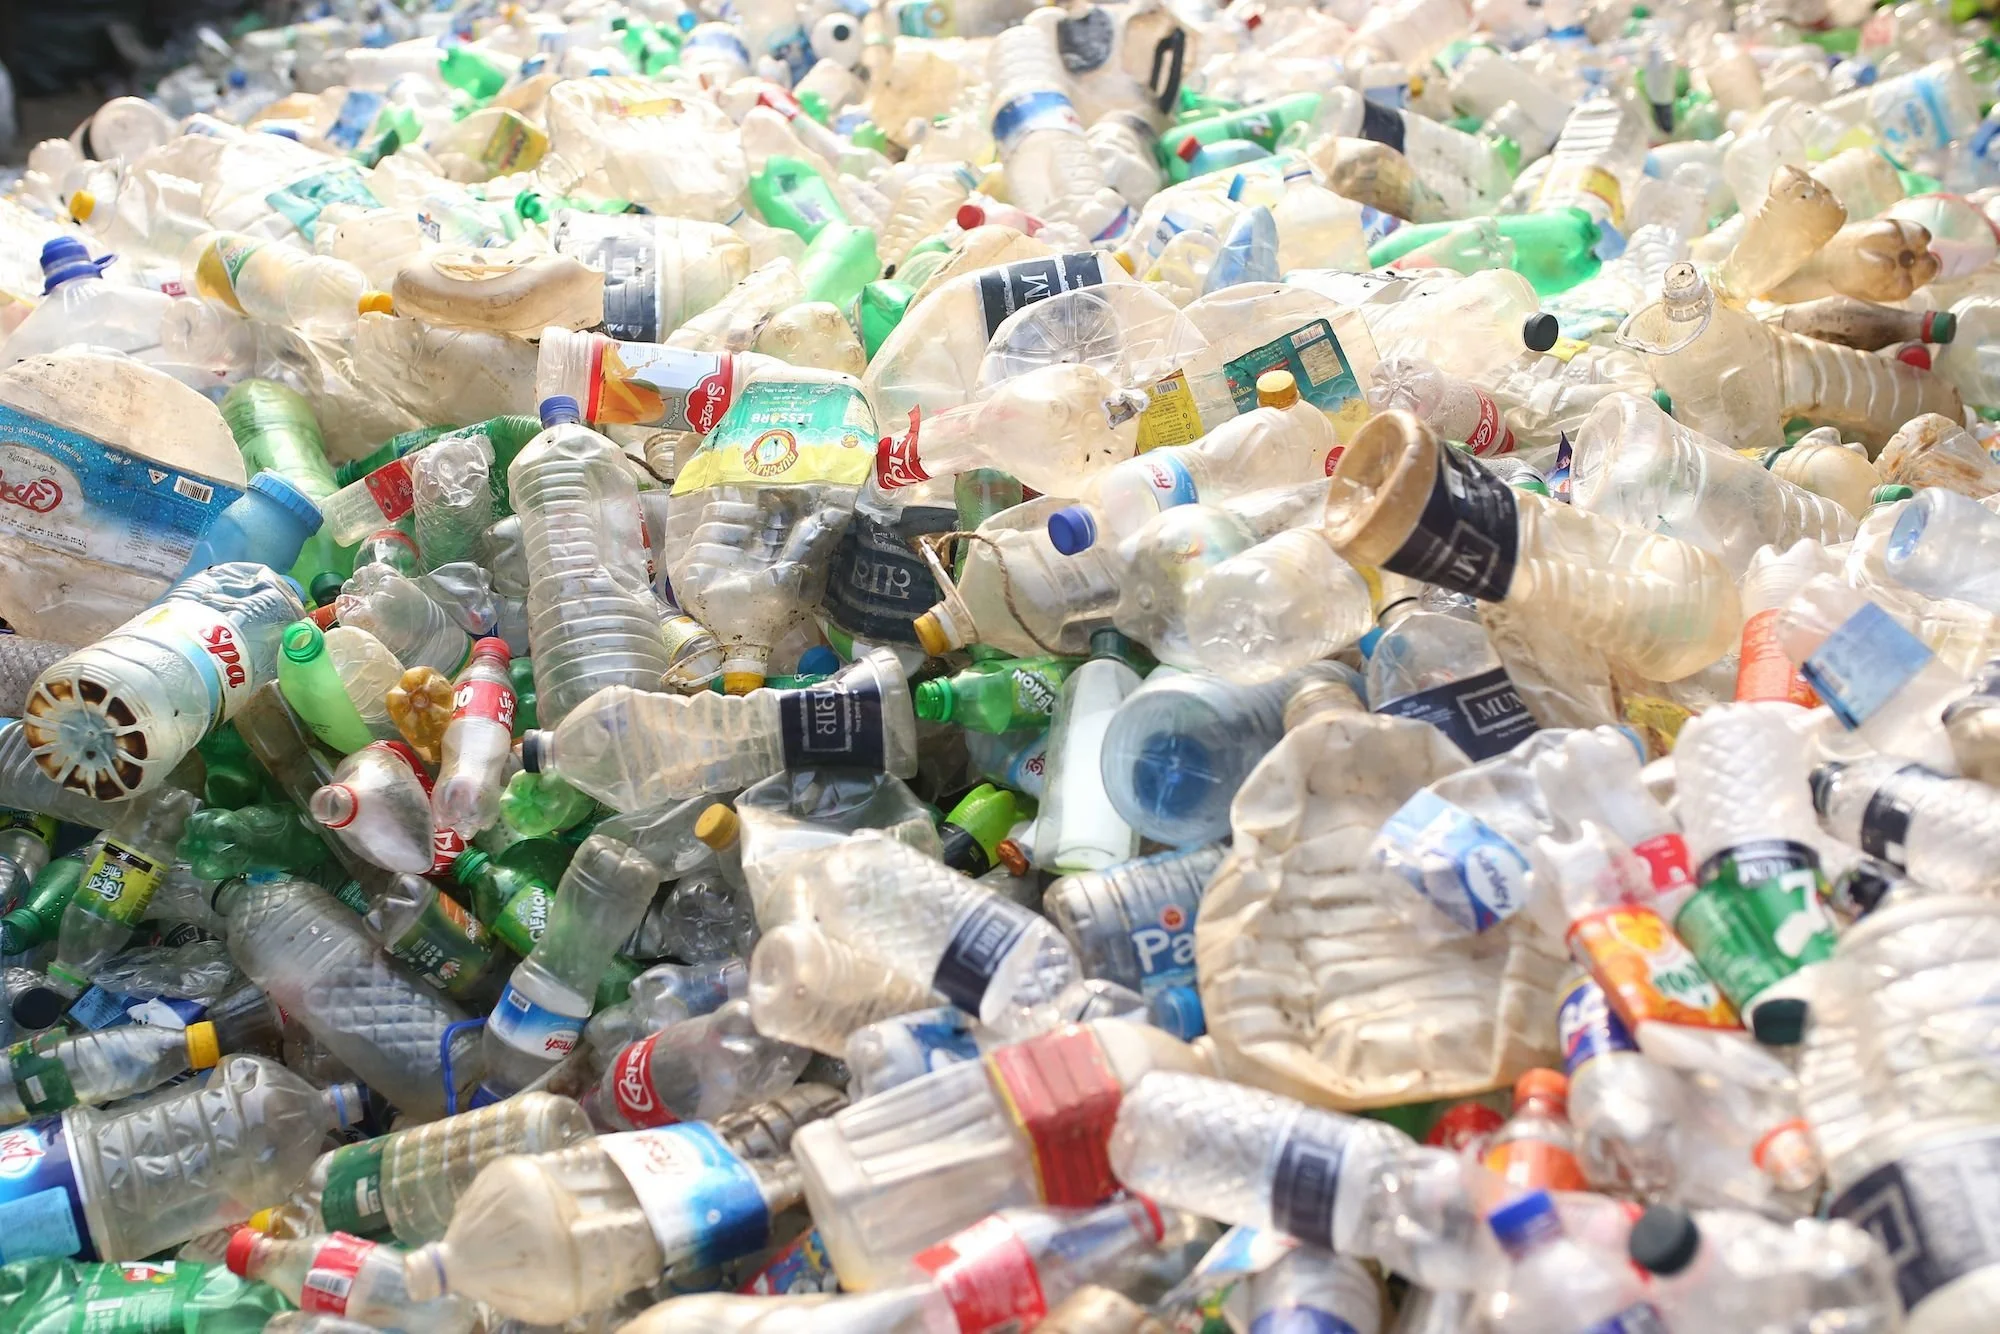
I knew I wanted to use recycled materials for the project to really emphasize the main points and asked my housemates to save a variety of plastic containers for me after they were done.
THE CODE
Building on my previous robot project where I programed one servo to swipe back and forth in a “cleaning motion,” I added two more servos into the mix. The servo “arms” would block the holes that the pellets would flow through and their speed and angle would allow the pellets to flow through at different rates to their respective containers.
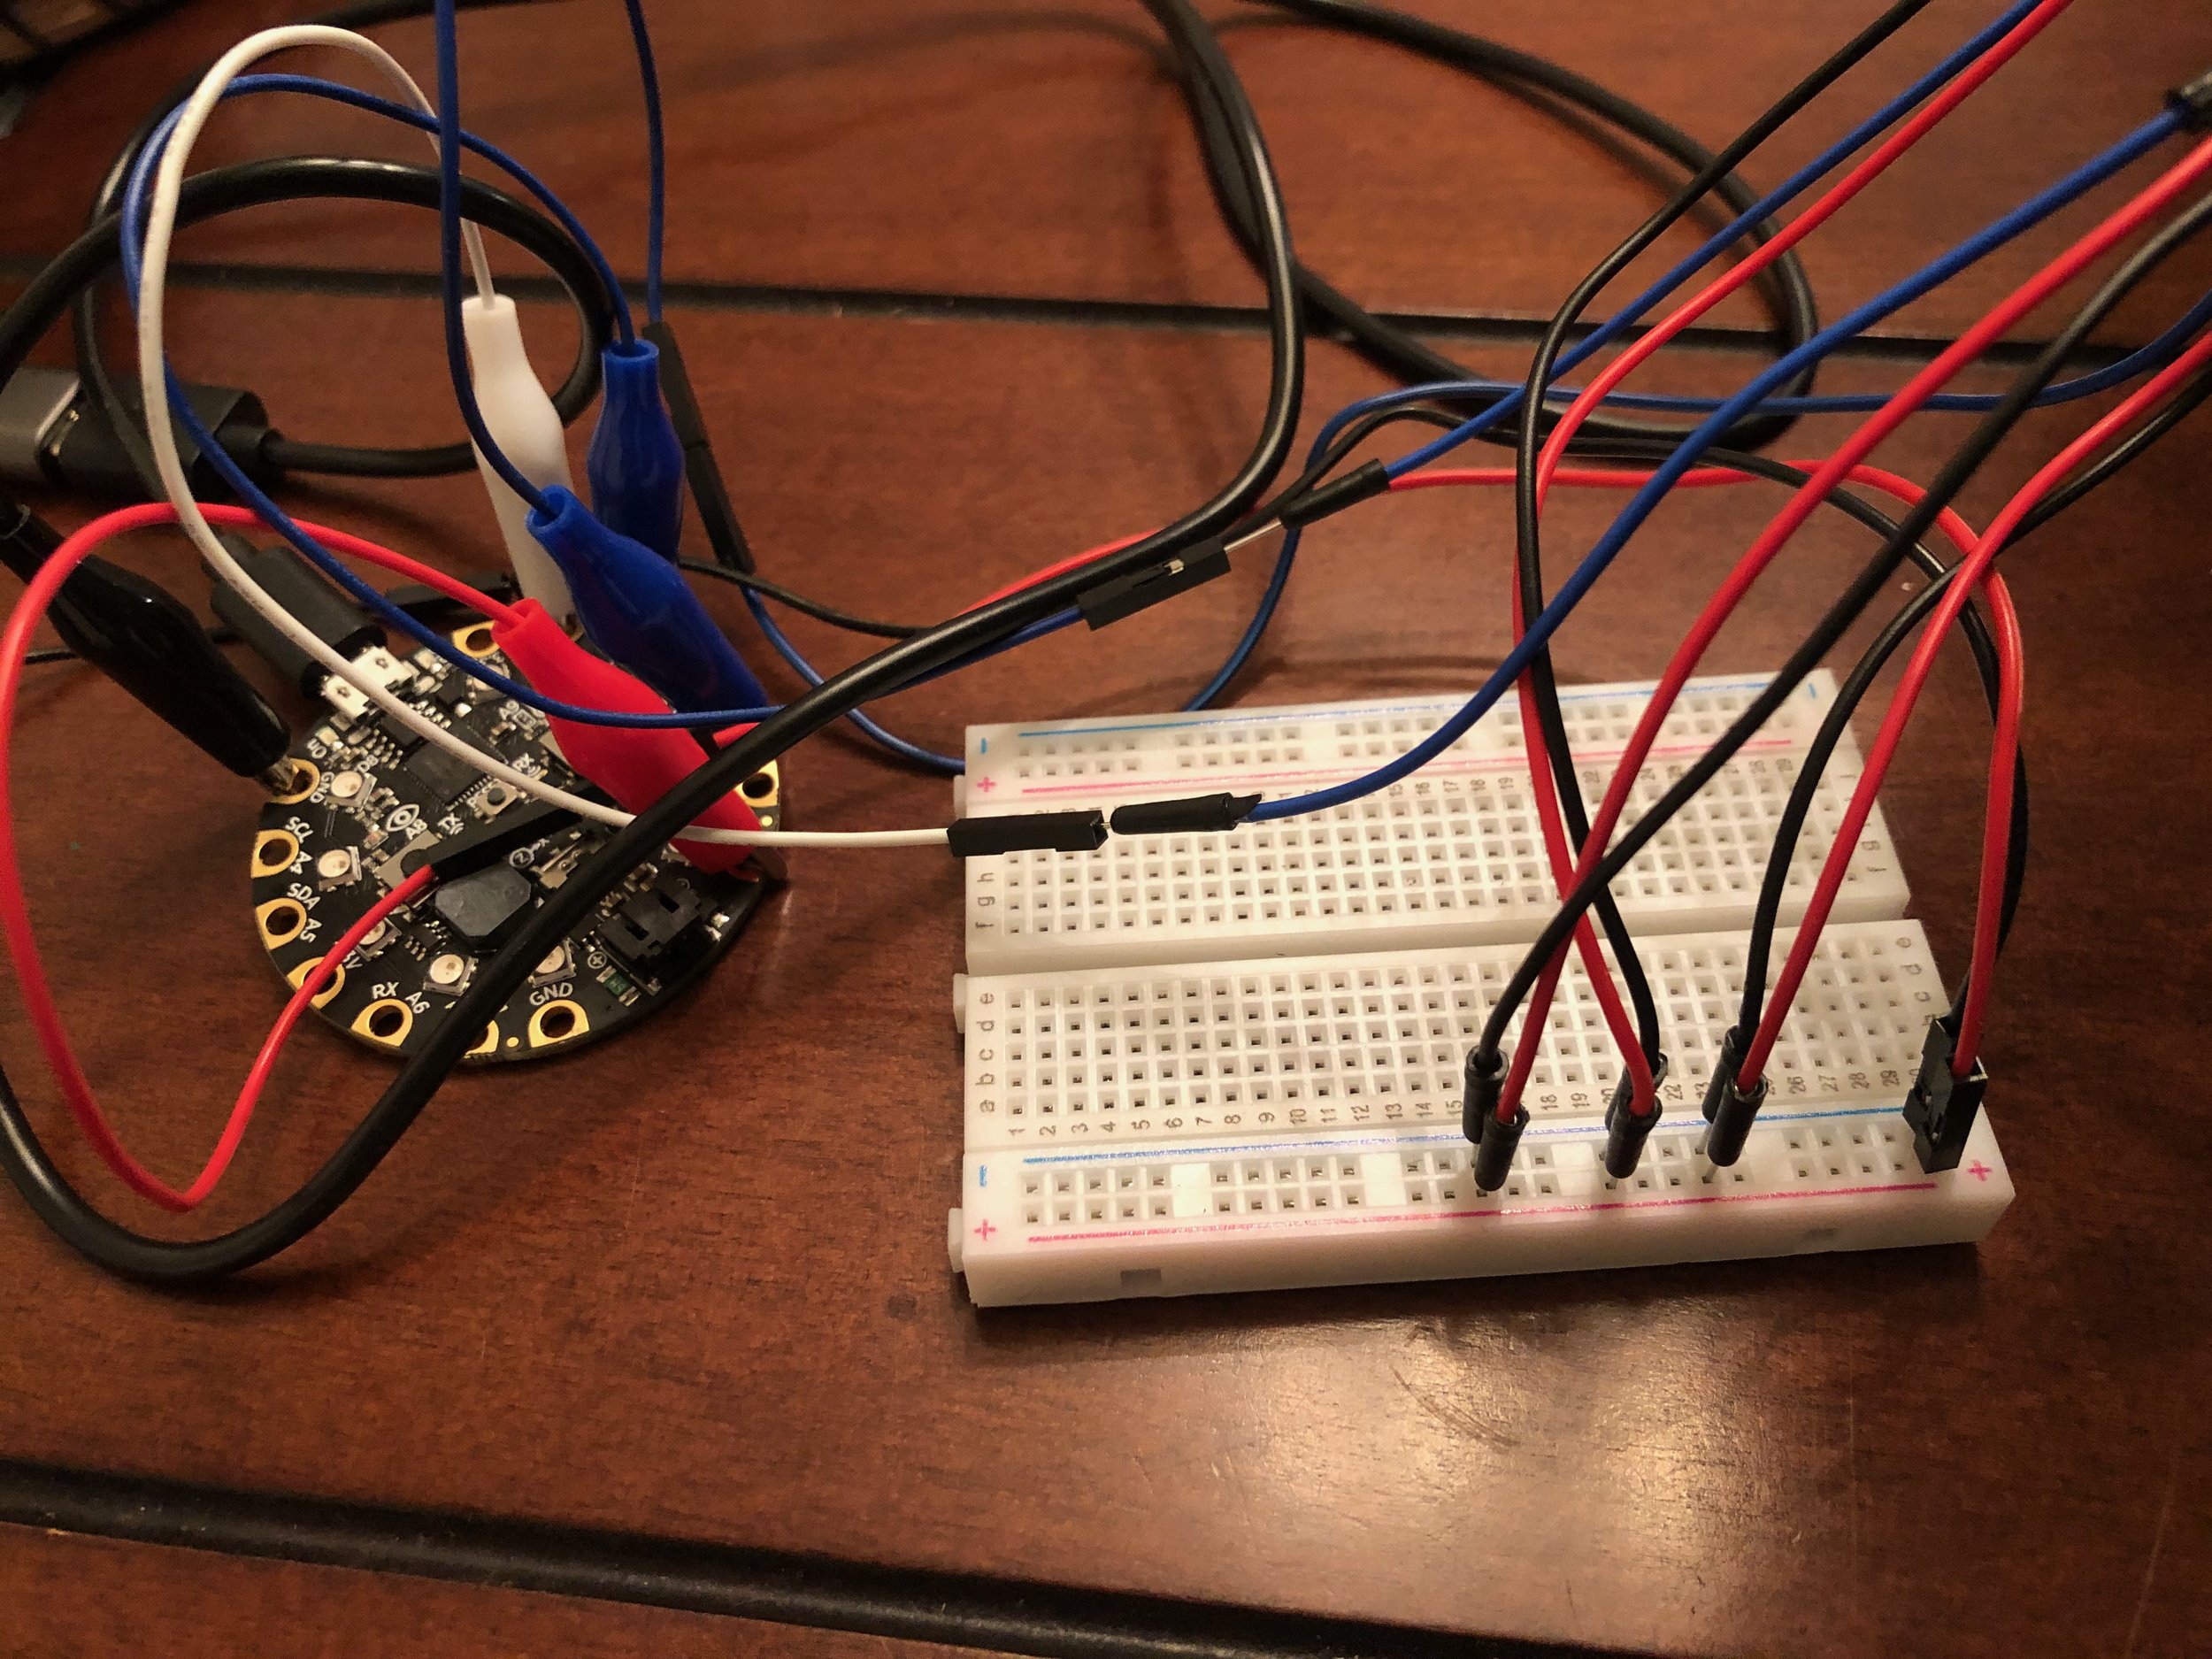
I used the Adafruit Circuit Playground microcontroller, a breadboard, and alligator clips to program the servos and connect them to power
When writing the code, I wanted one of the servos — the one that would filter pellets into the “recycling” container to move at a rate that would allow fewer pellets into recycling than the other two containers, given that only 9% of plastic is recycled. Ideally, I would have liked to figure out a mechanical process that would release one pellet per second, where one out of every ten pellets goes to recycling. I found out that this was very difficult to achieve in tandem with the physical construction of the project. I tried my best, and In playing around with the servos, I adjusted the sleep time and angle of servo B so that the arm spent the majority of time blocking the hole. I programmed servo B to only move at a 65 degree angle while servo A and C moved at a 90 degree angle, covering their holes for less time and allowing more pellets to drop.
MATERIALS & CONSTRUCTION
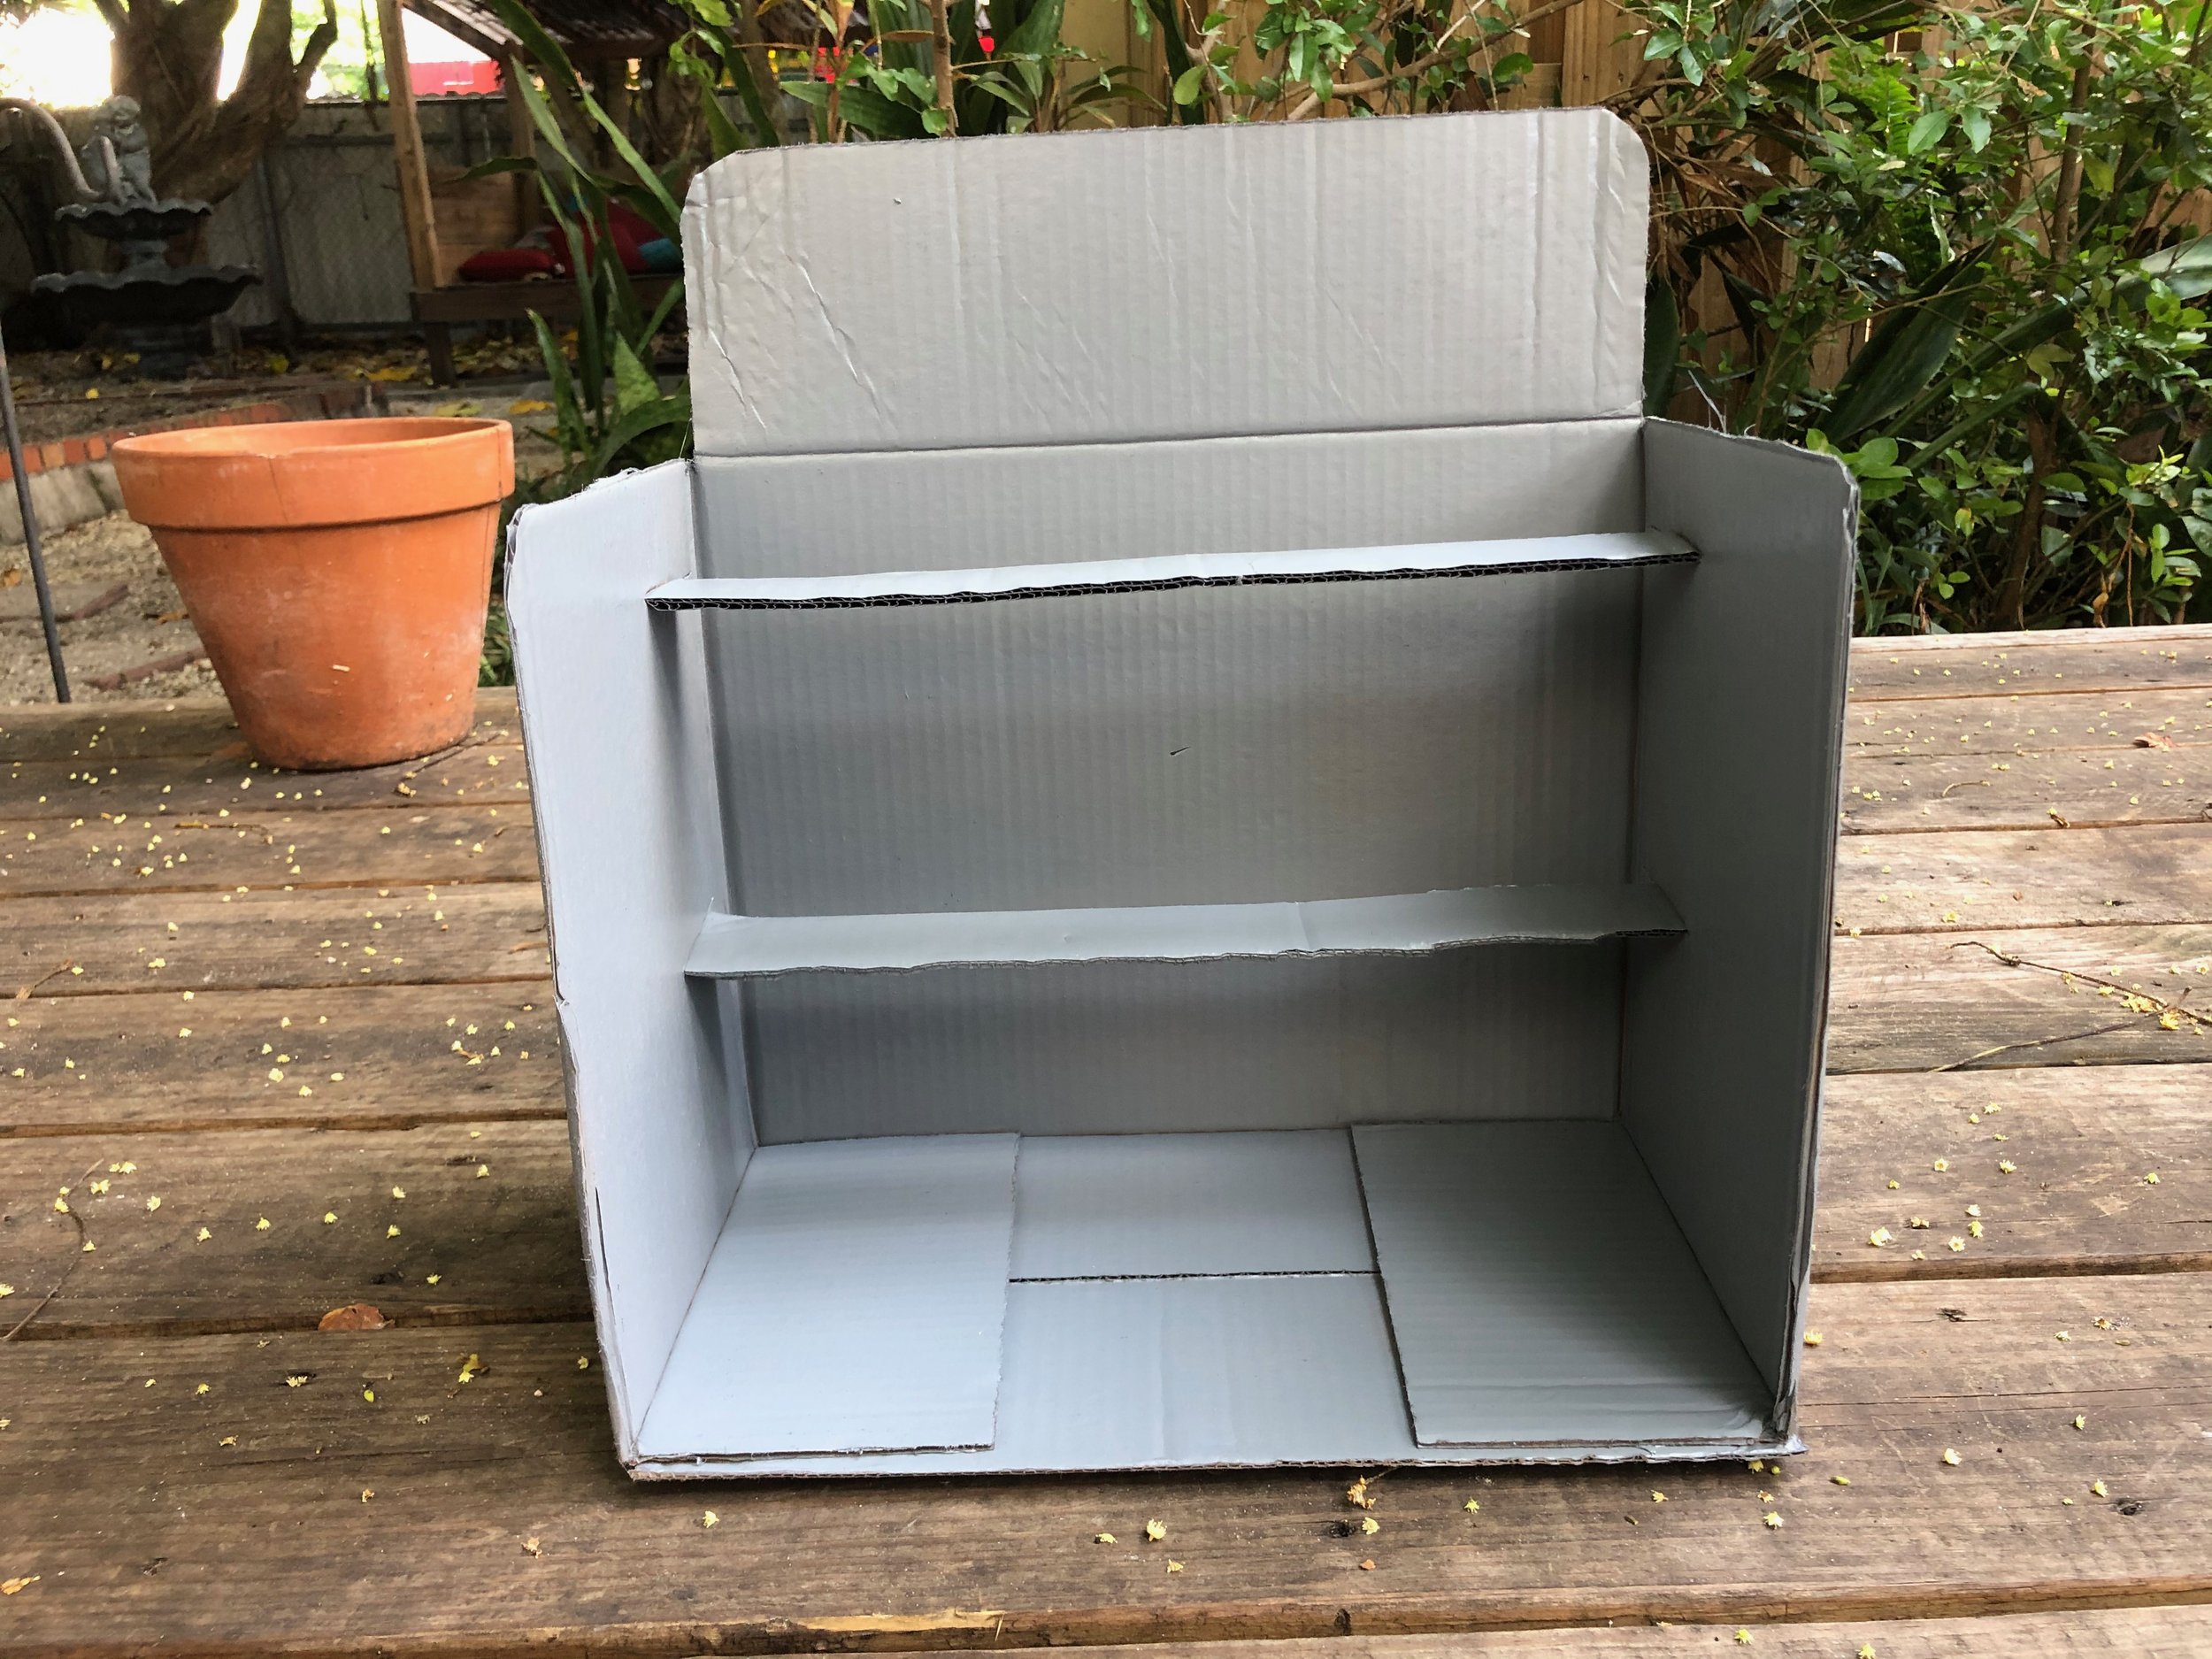
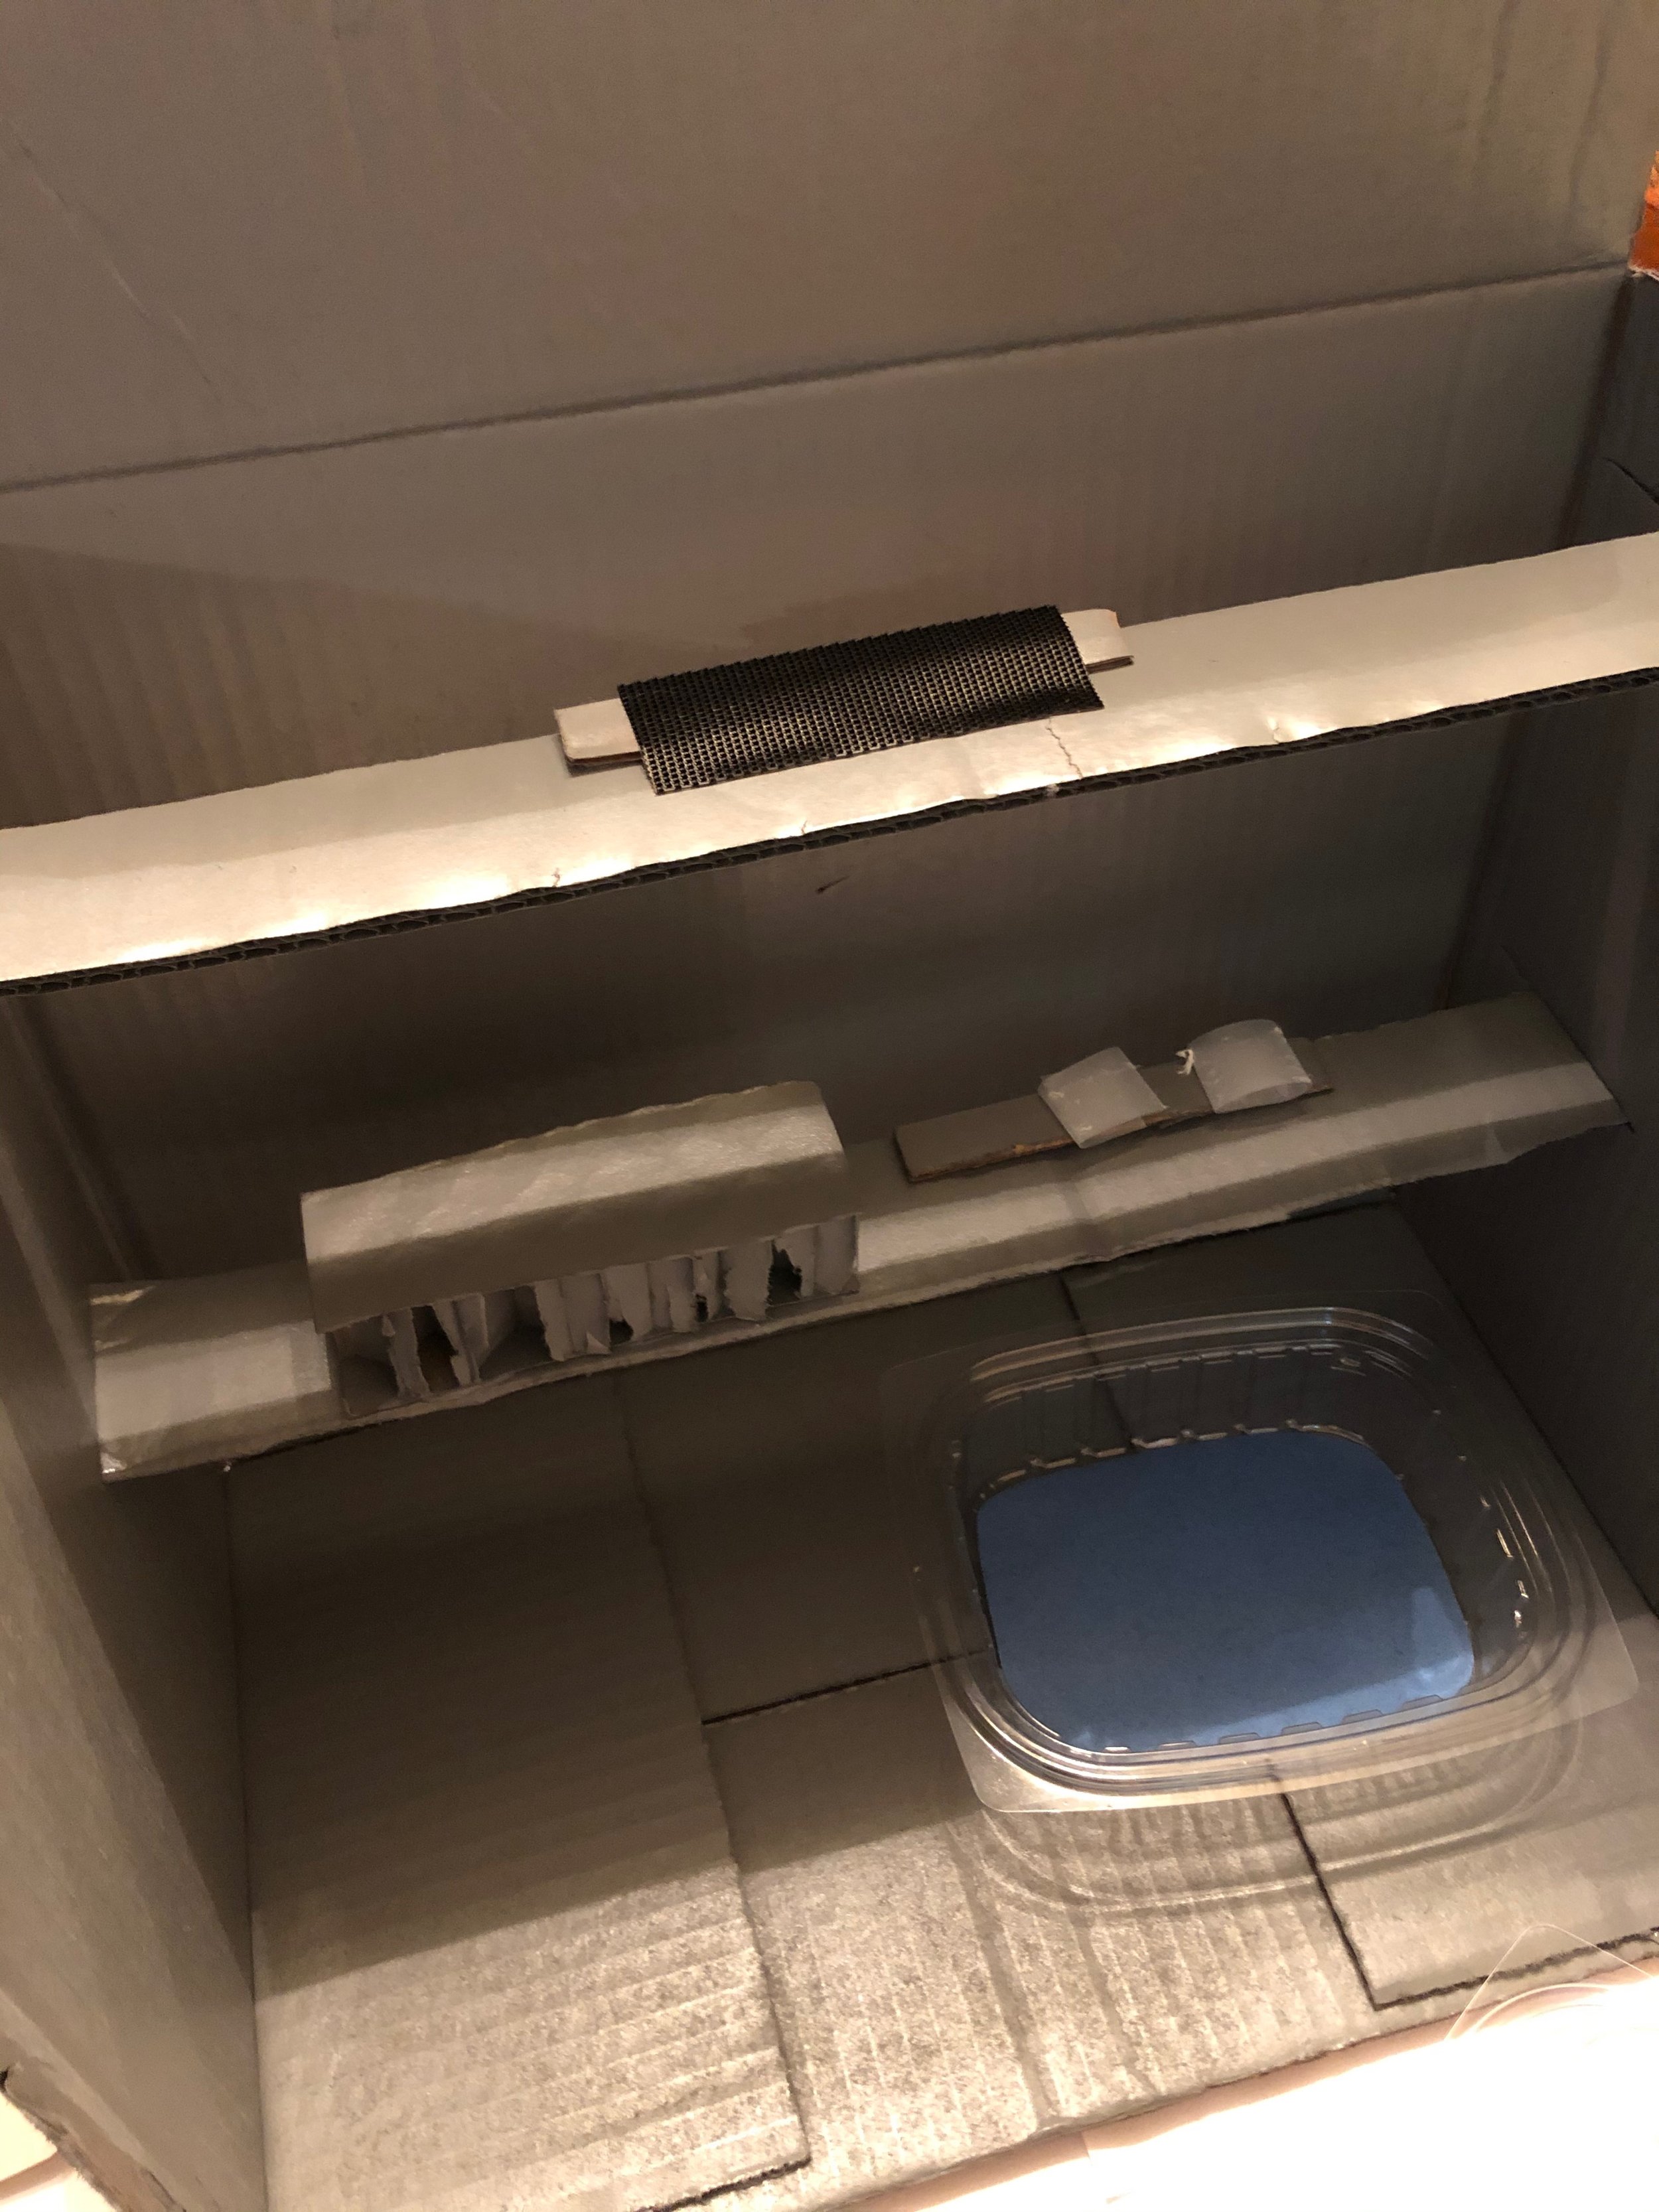
I decided the easiest base for my project would be a cardboard box. I cut the front of one out and started experimenting with other packaging materials around the house.
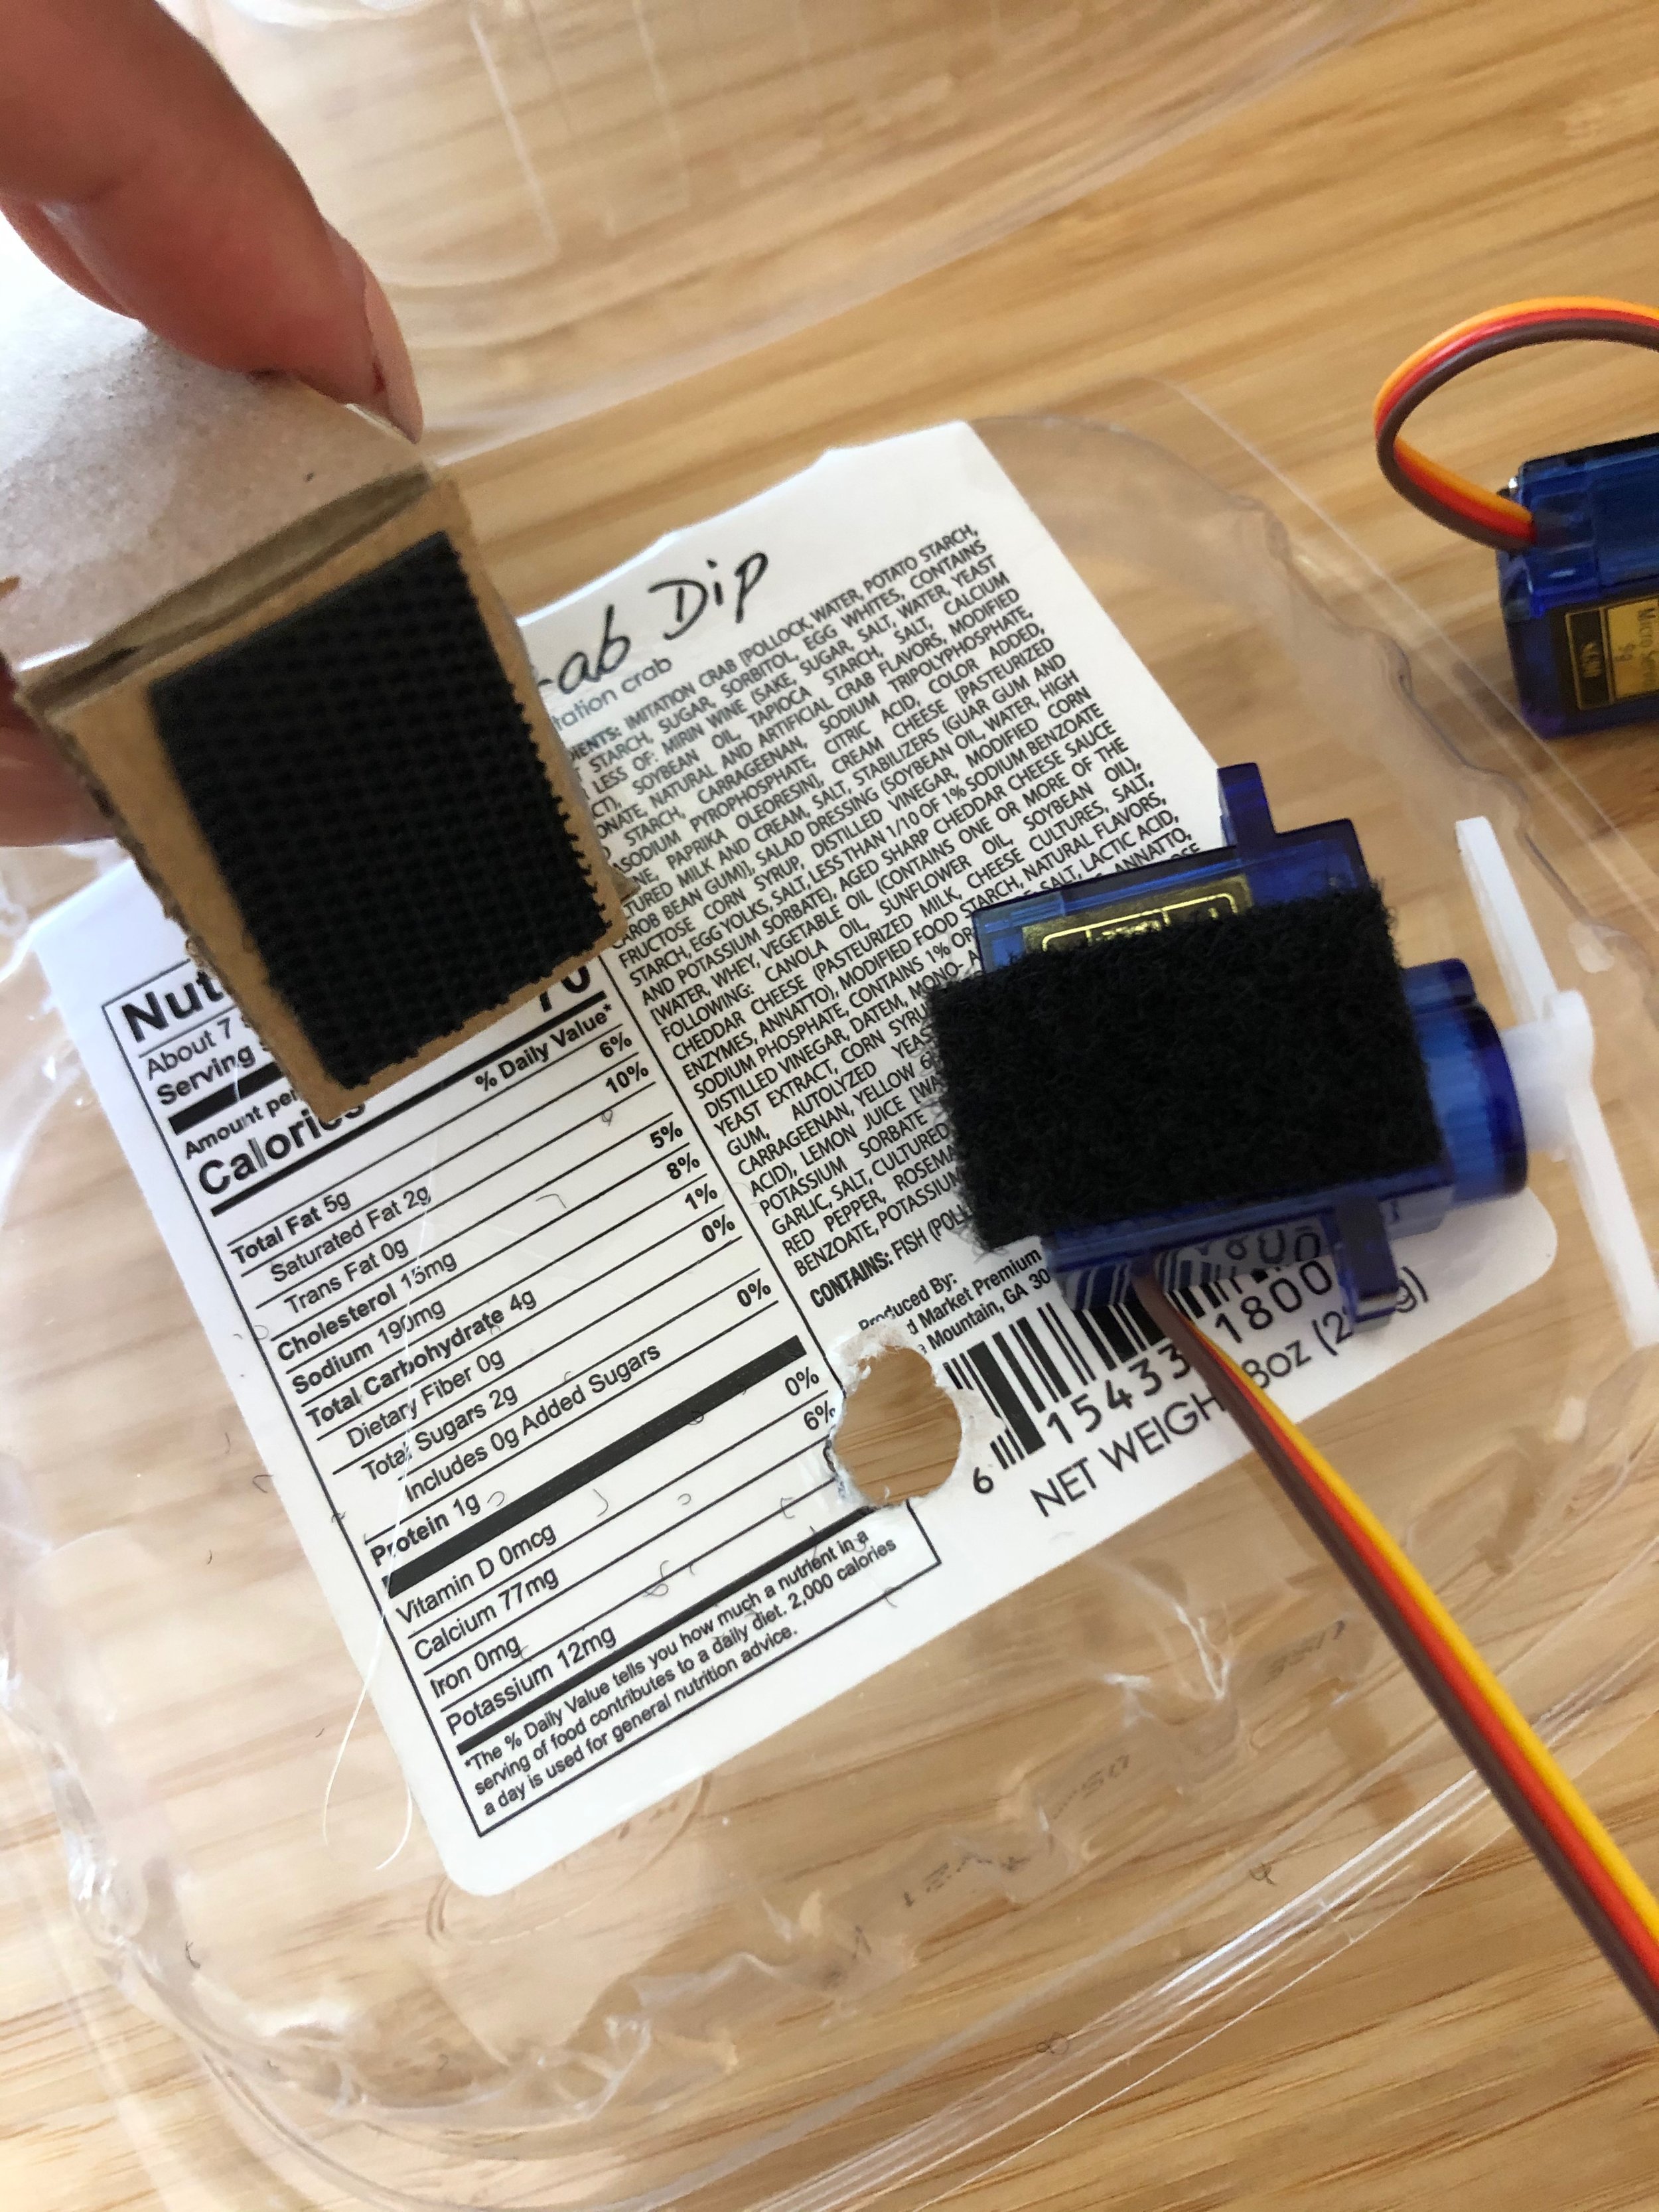
Next, I cut holes at the bottom of my containers just big enough to let the pellets through and small enough to be blocked by the servo arms.
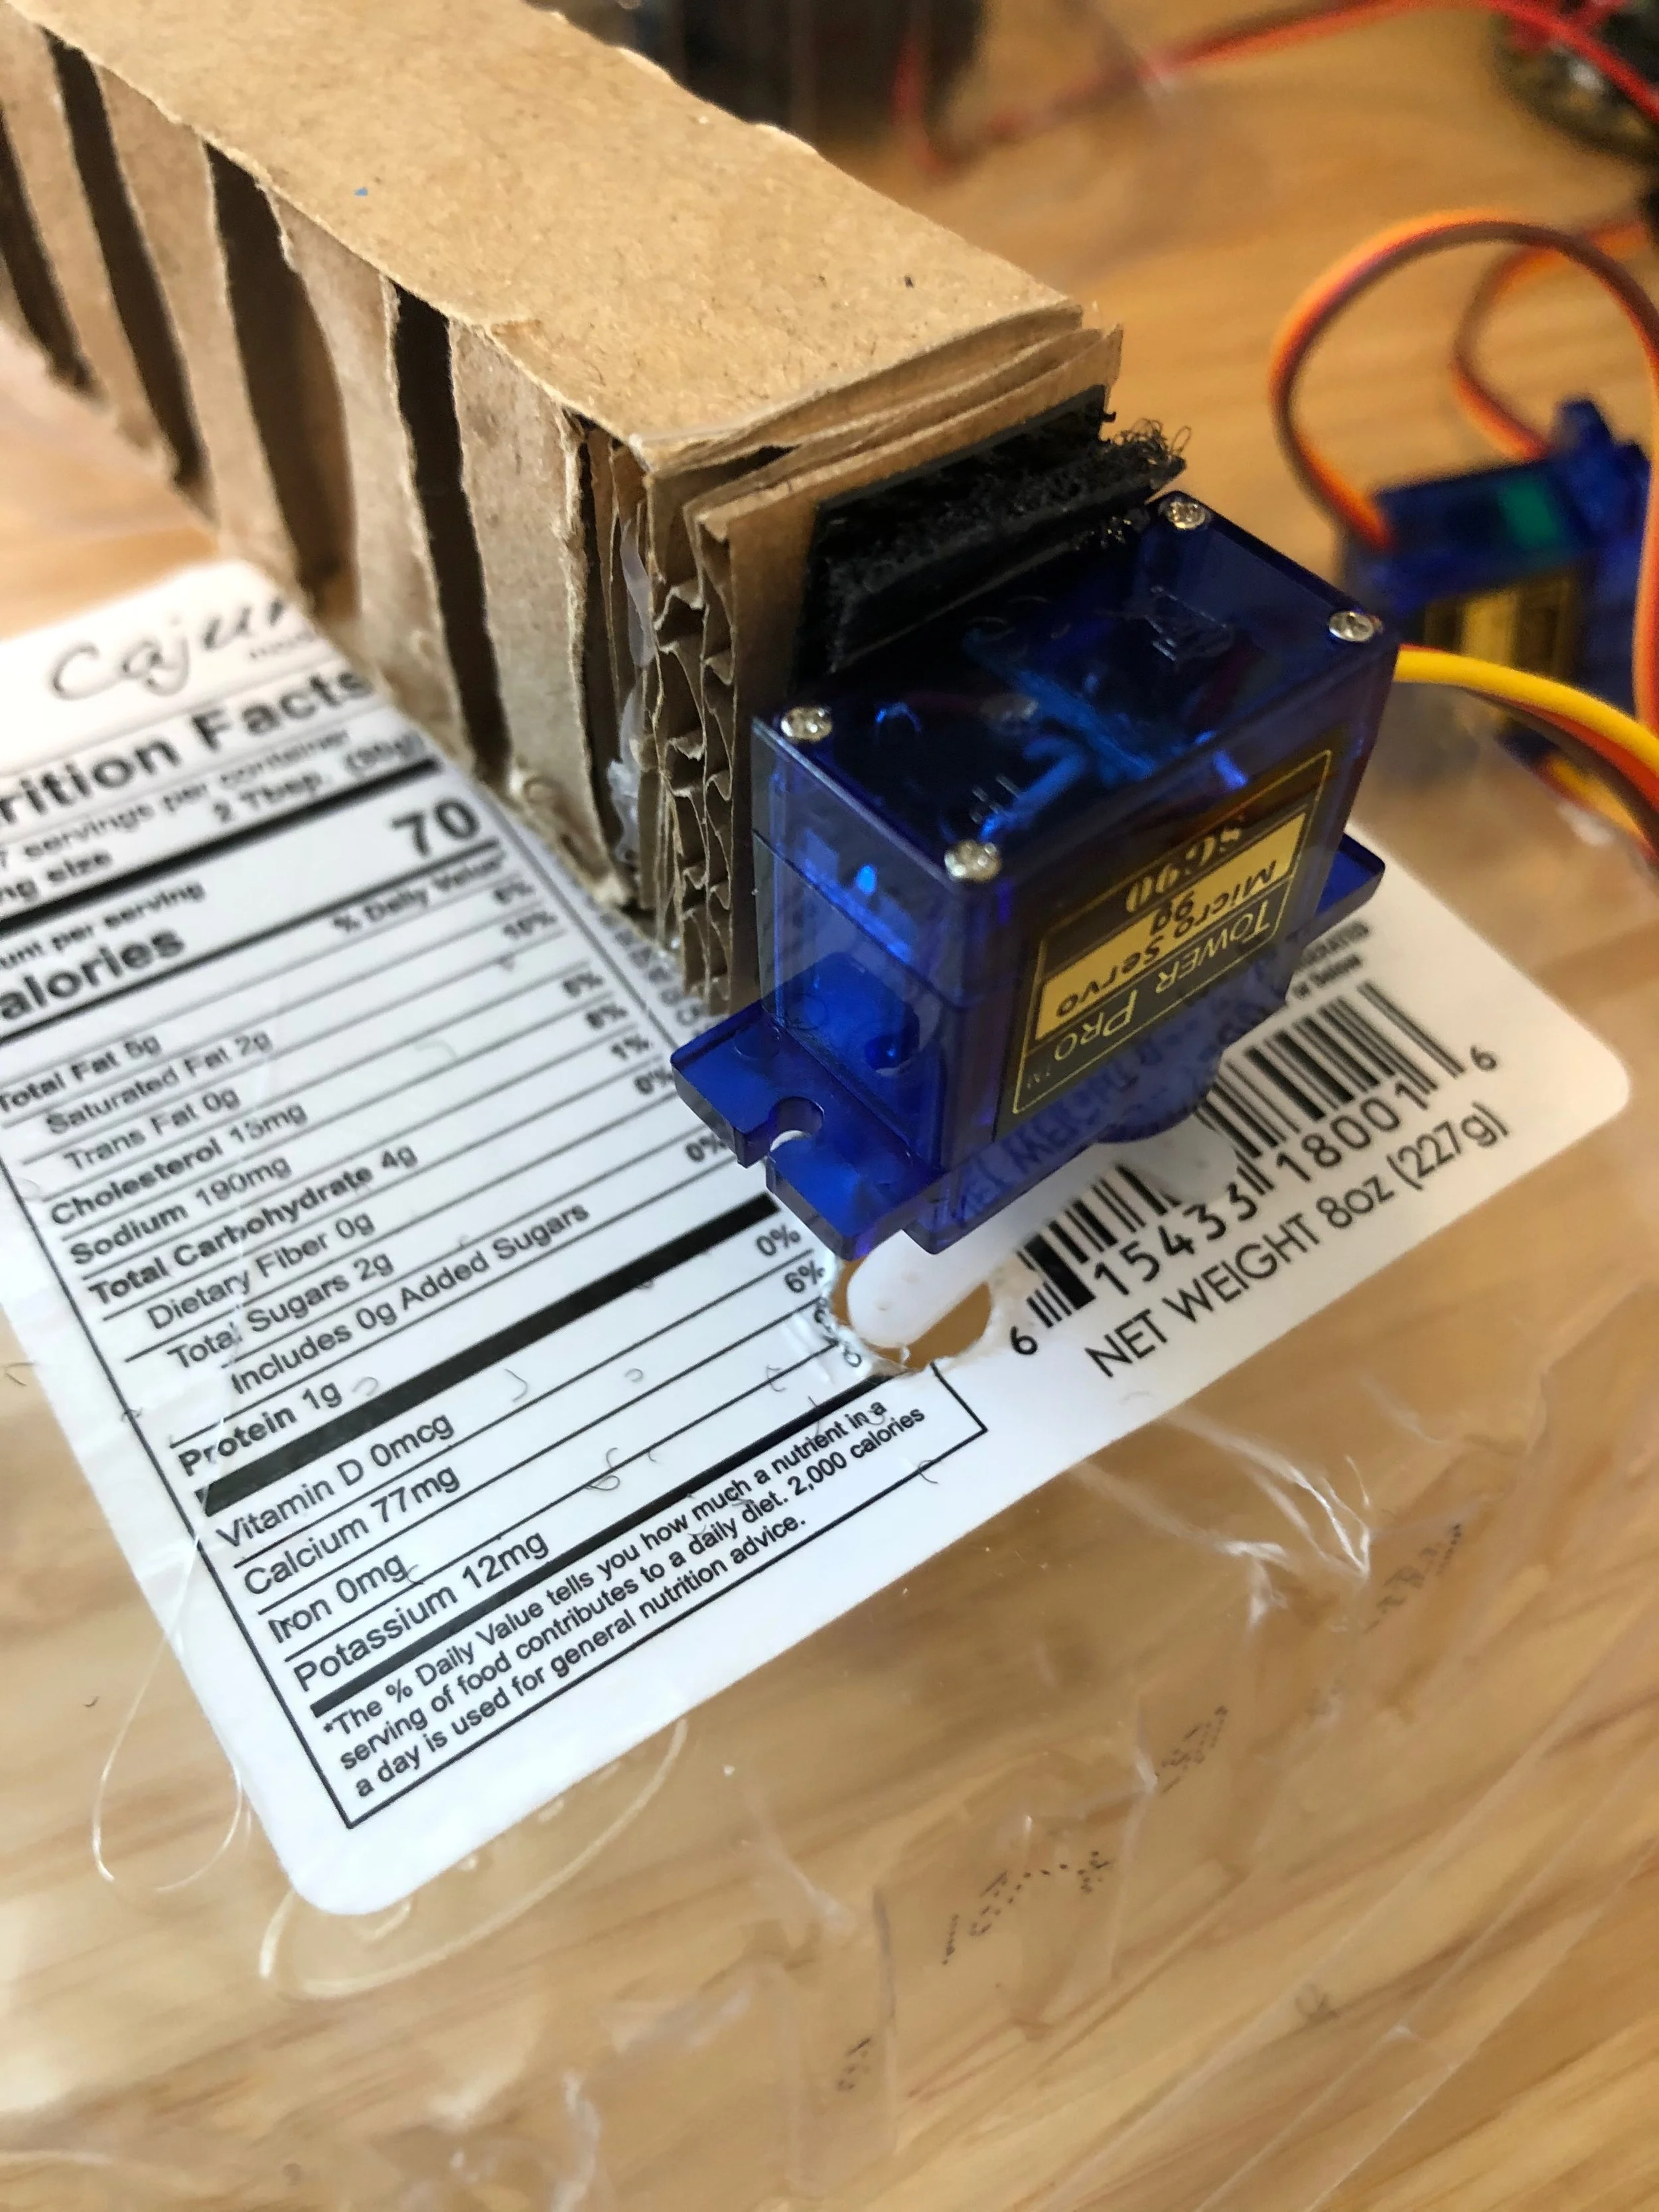
I knew I was going to need a lot of flexibility in the positioning of the containers and the servos in order to let the pellets flow in the way that I wanted so I started taking that into account right away. I decided that I was going to attach my servos and my containers to the box with velcro so that I could reposition them if they were at the wrong angle.
Next, I constructed the box base and spray painted it gray. I wanted to ensure that the box had “shelves” to hold the containers with pellets and that they would be sturdy enough to handle the weight of the containers, pellets, and servos.
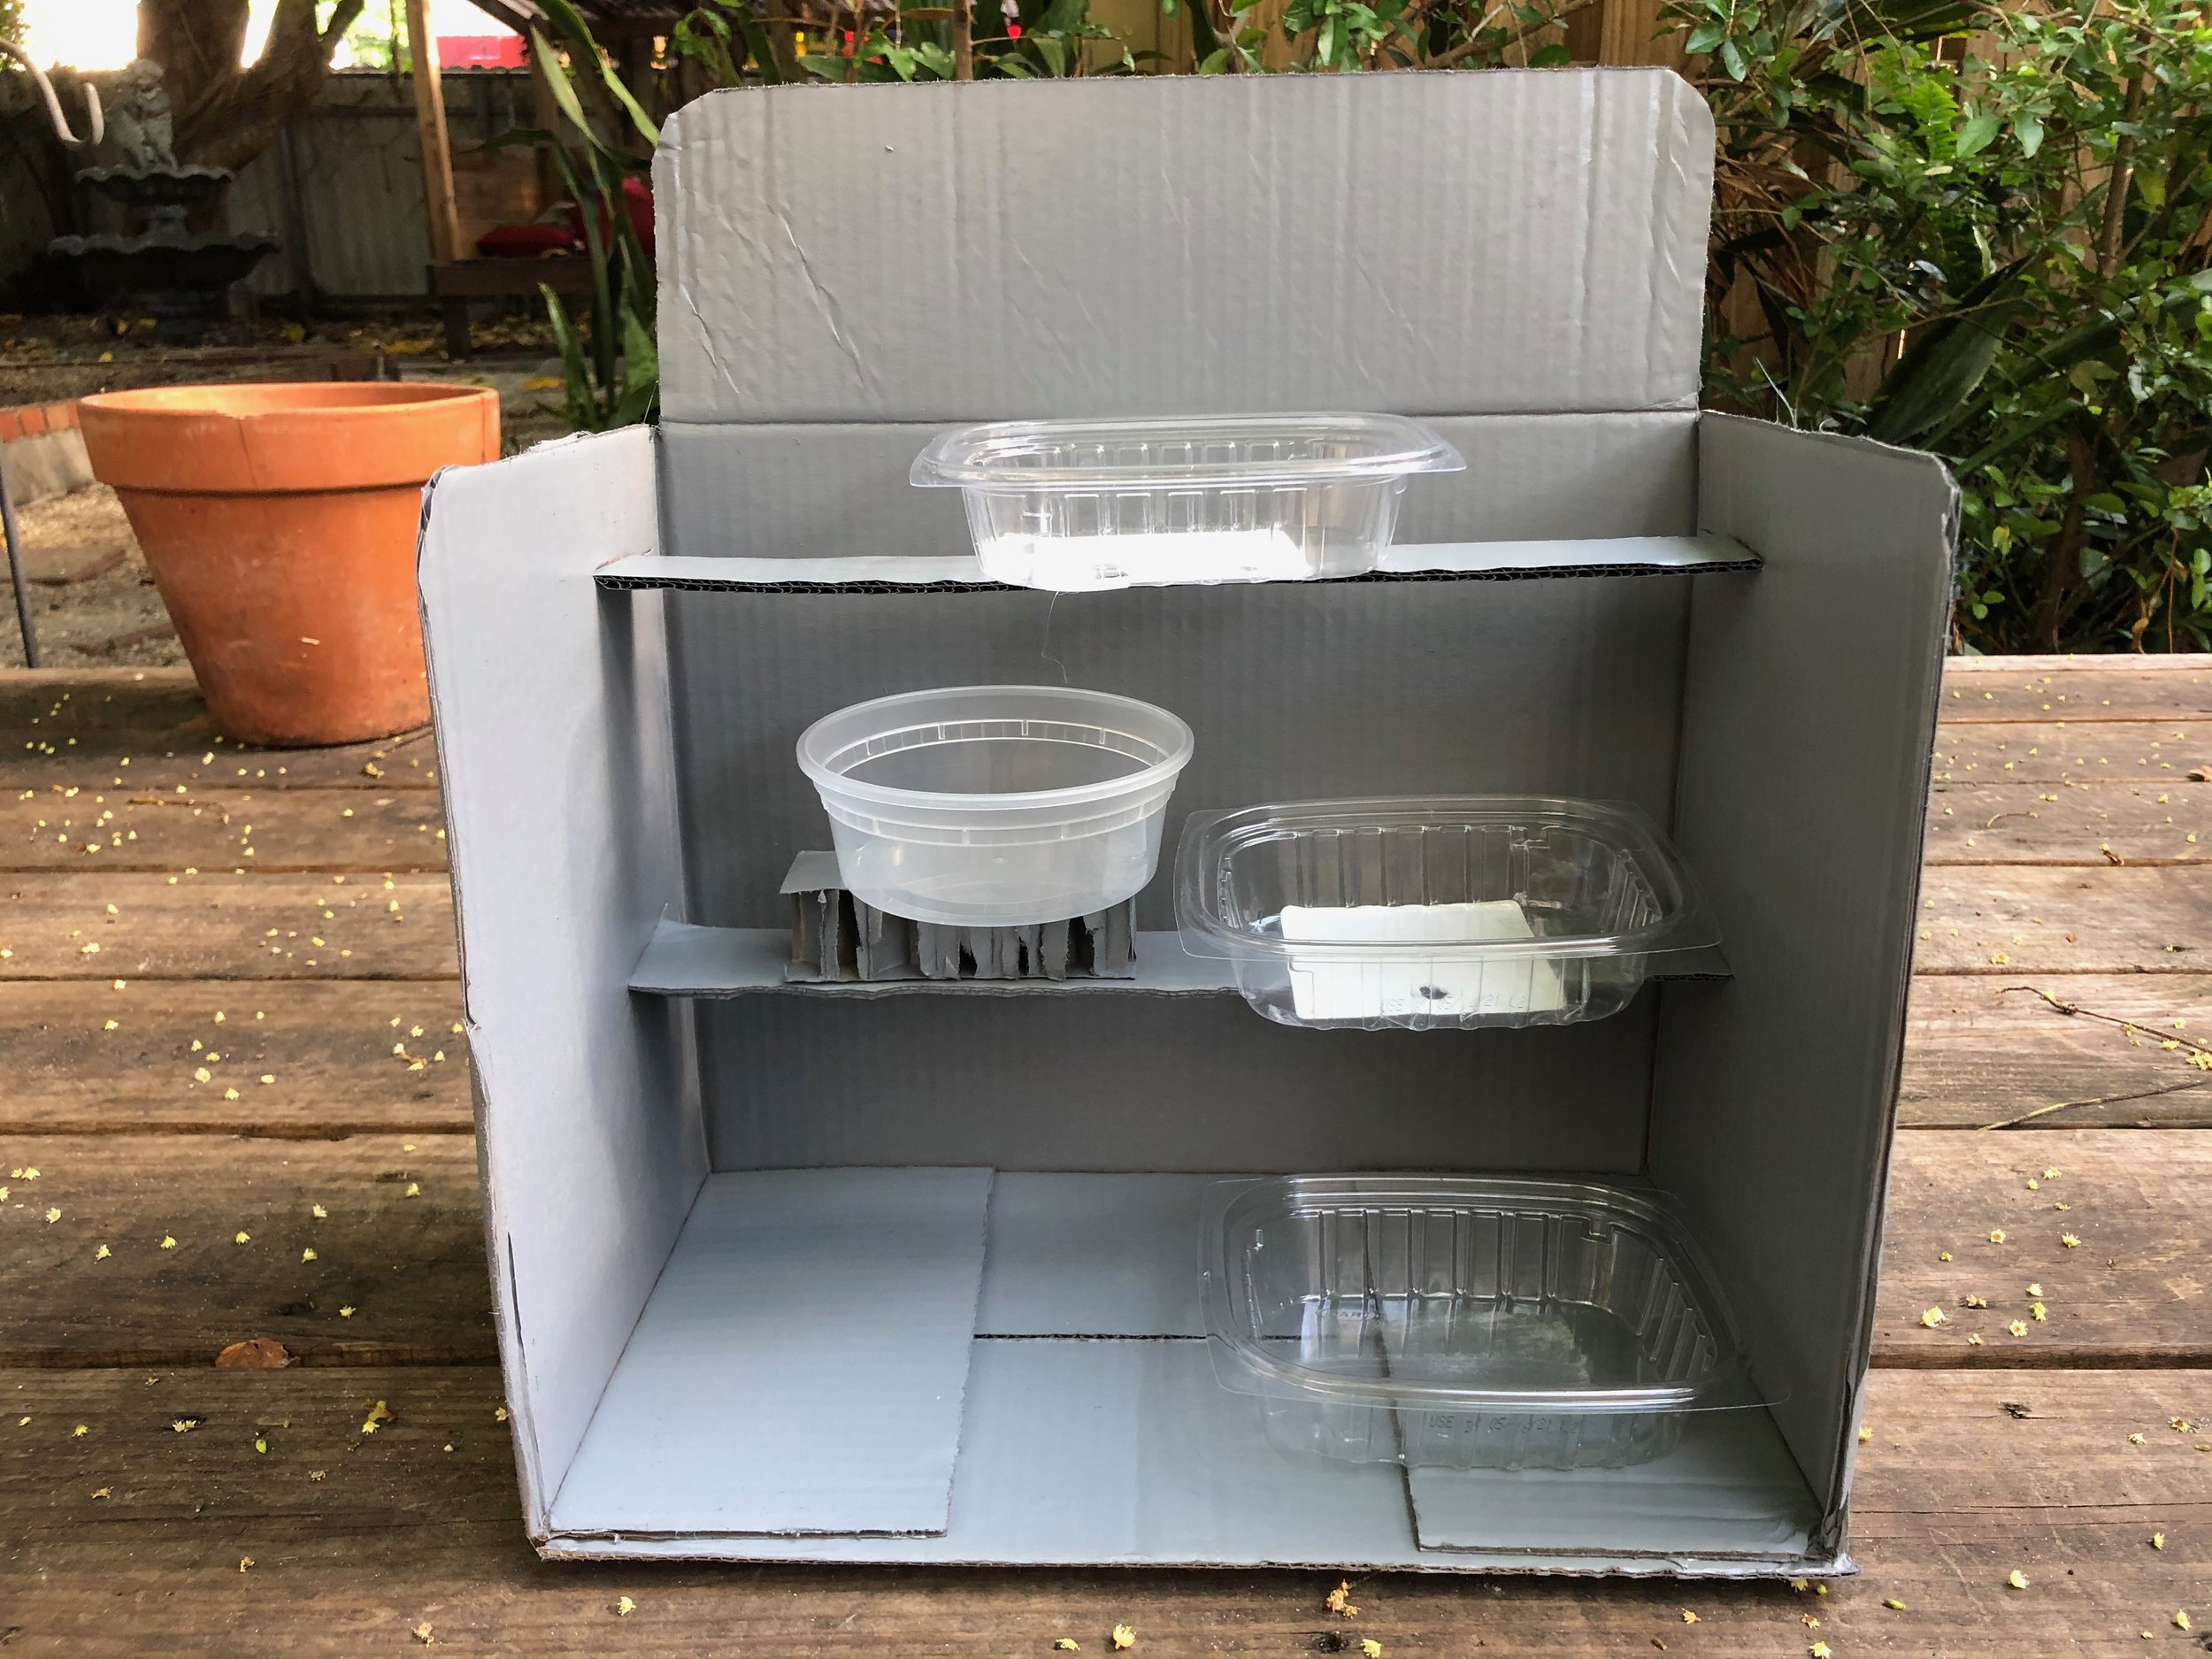
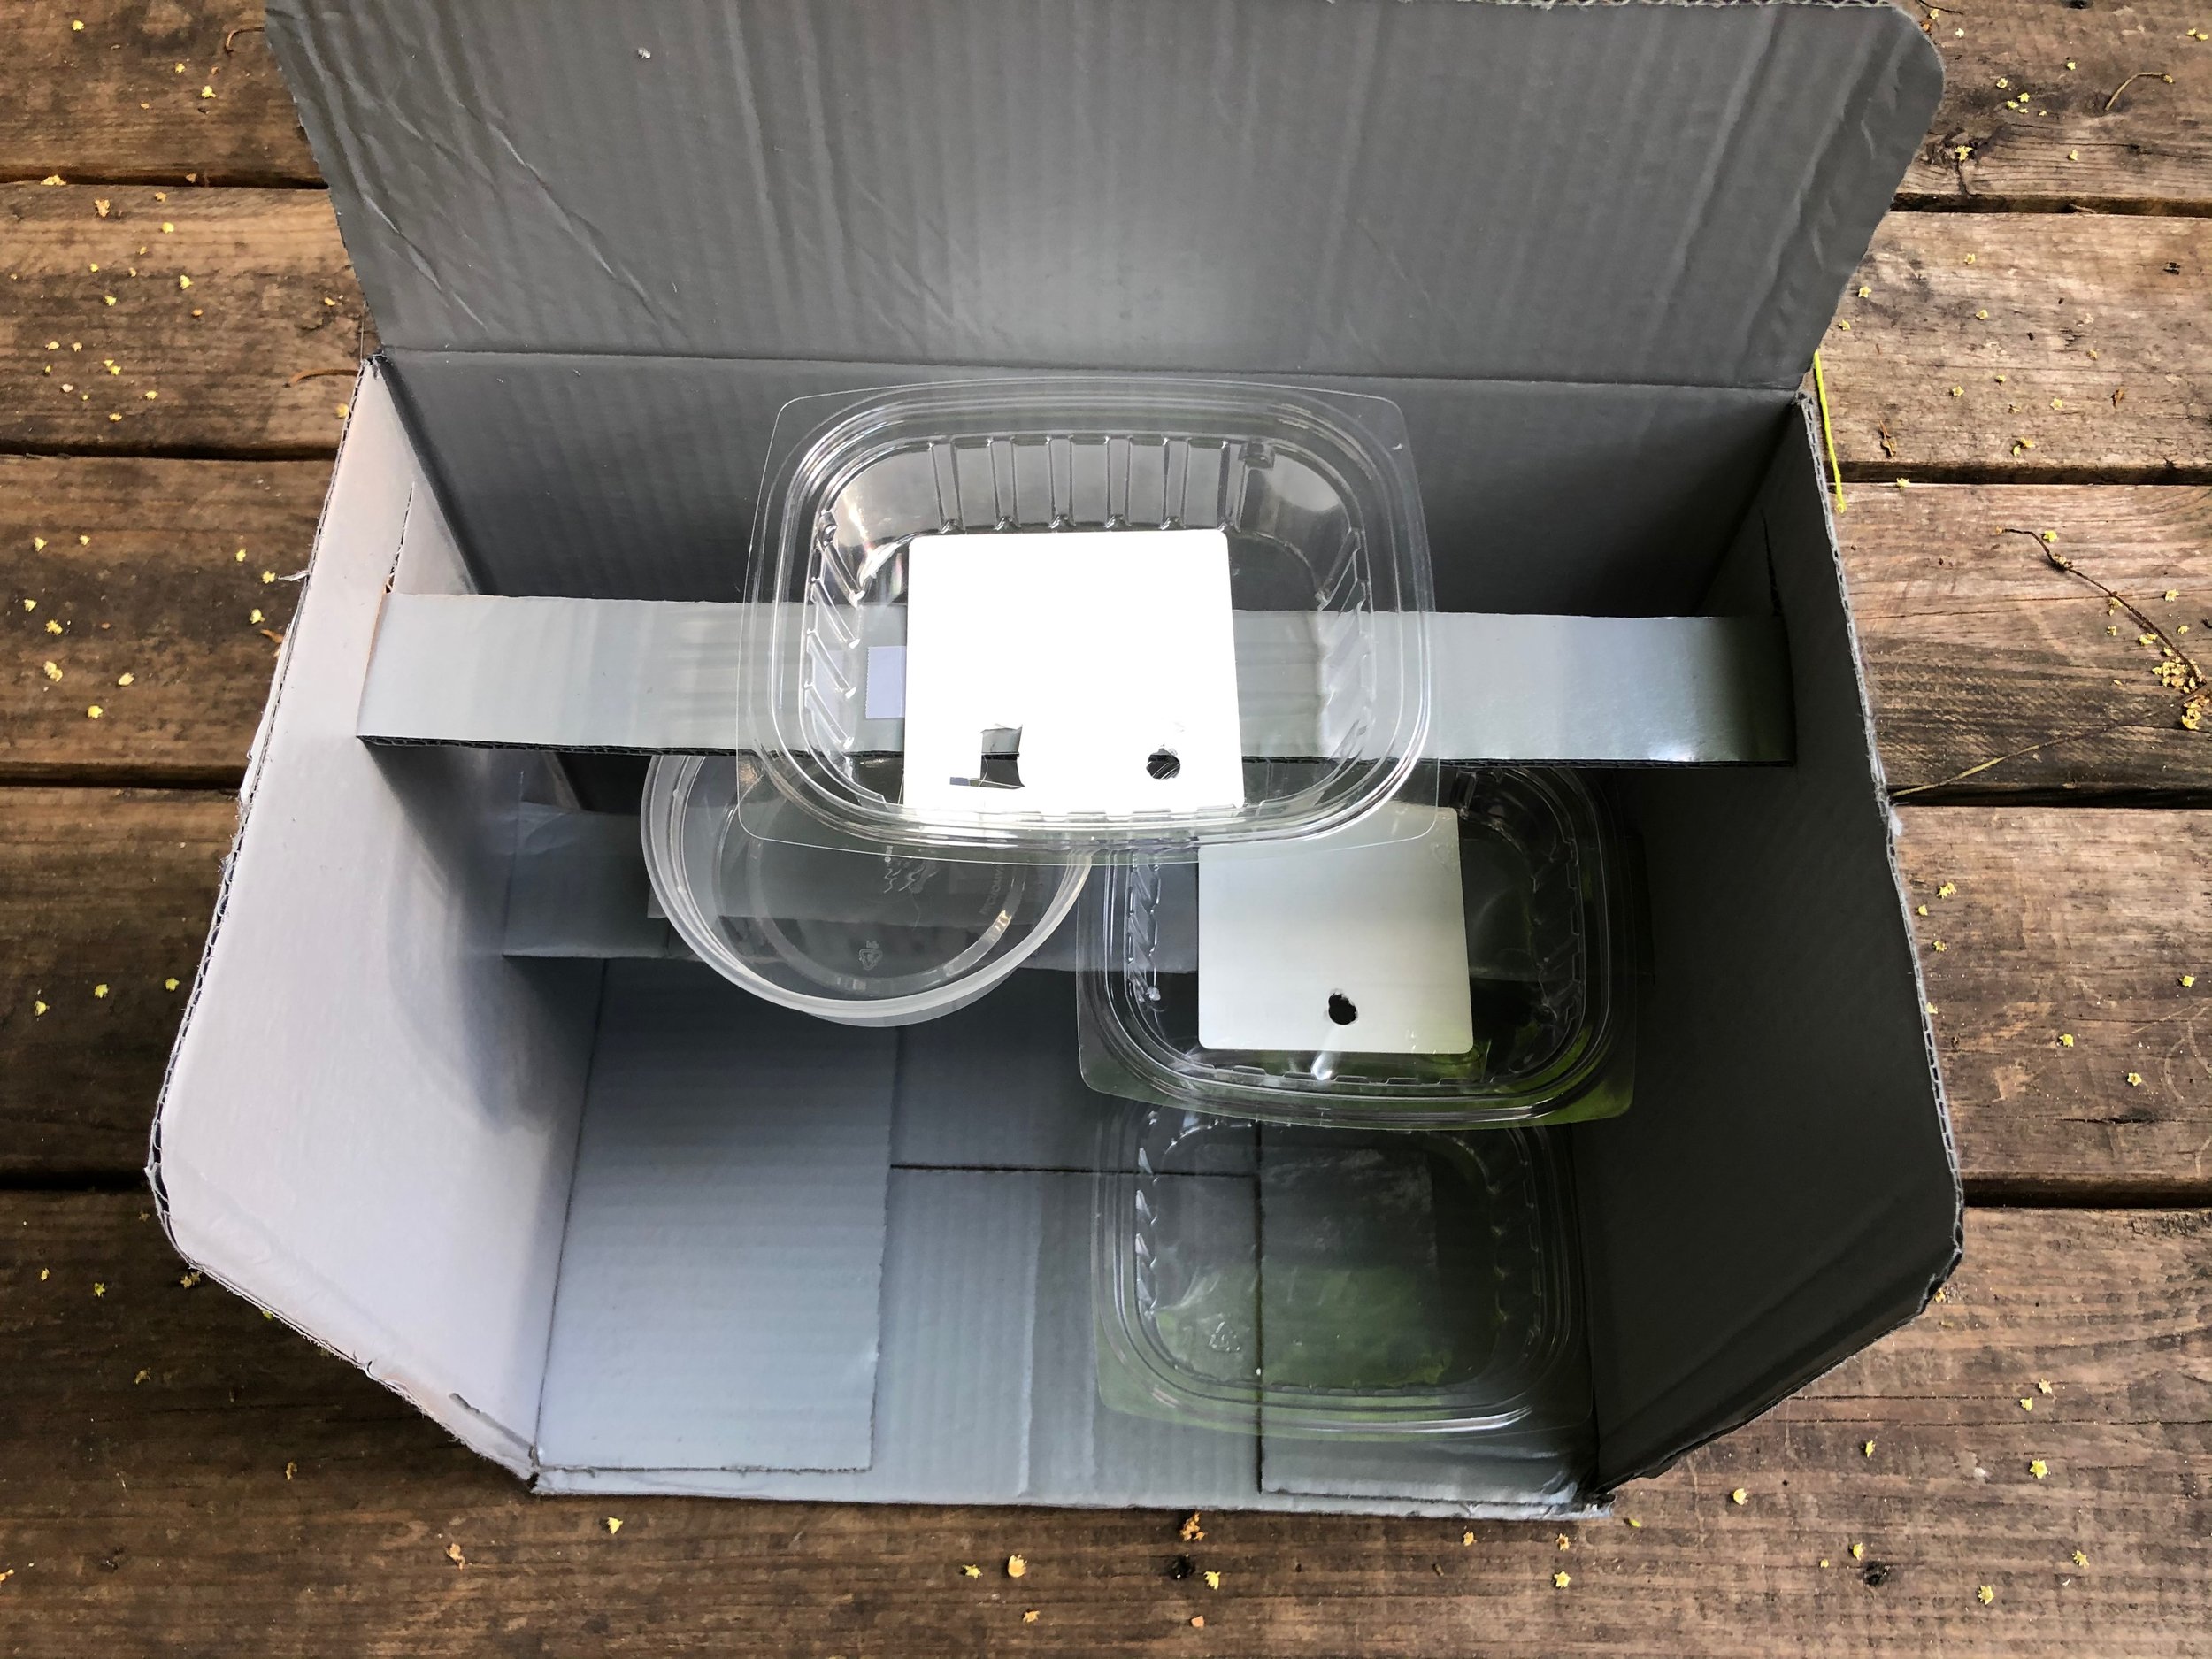
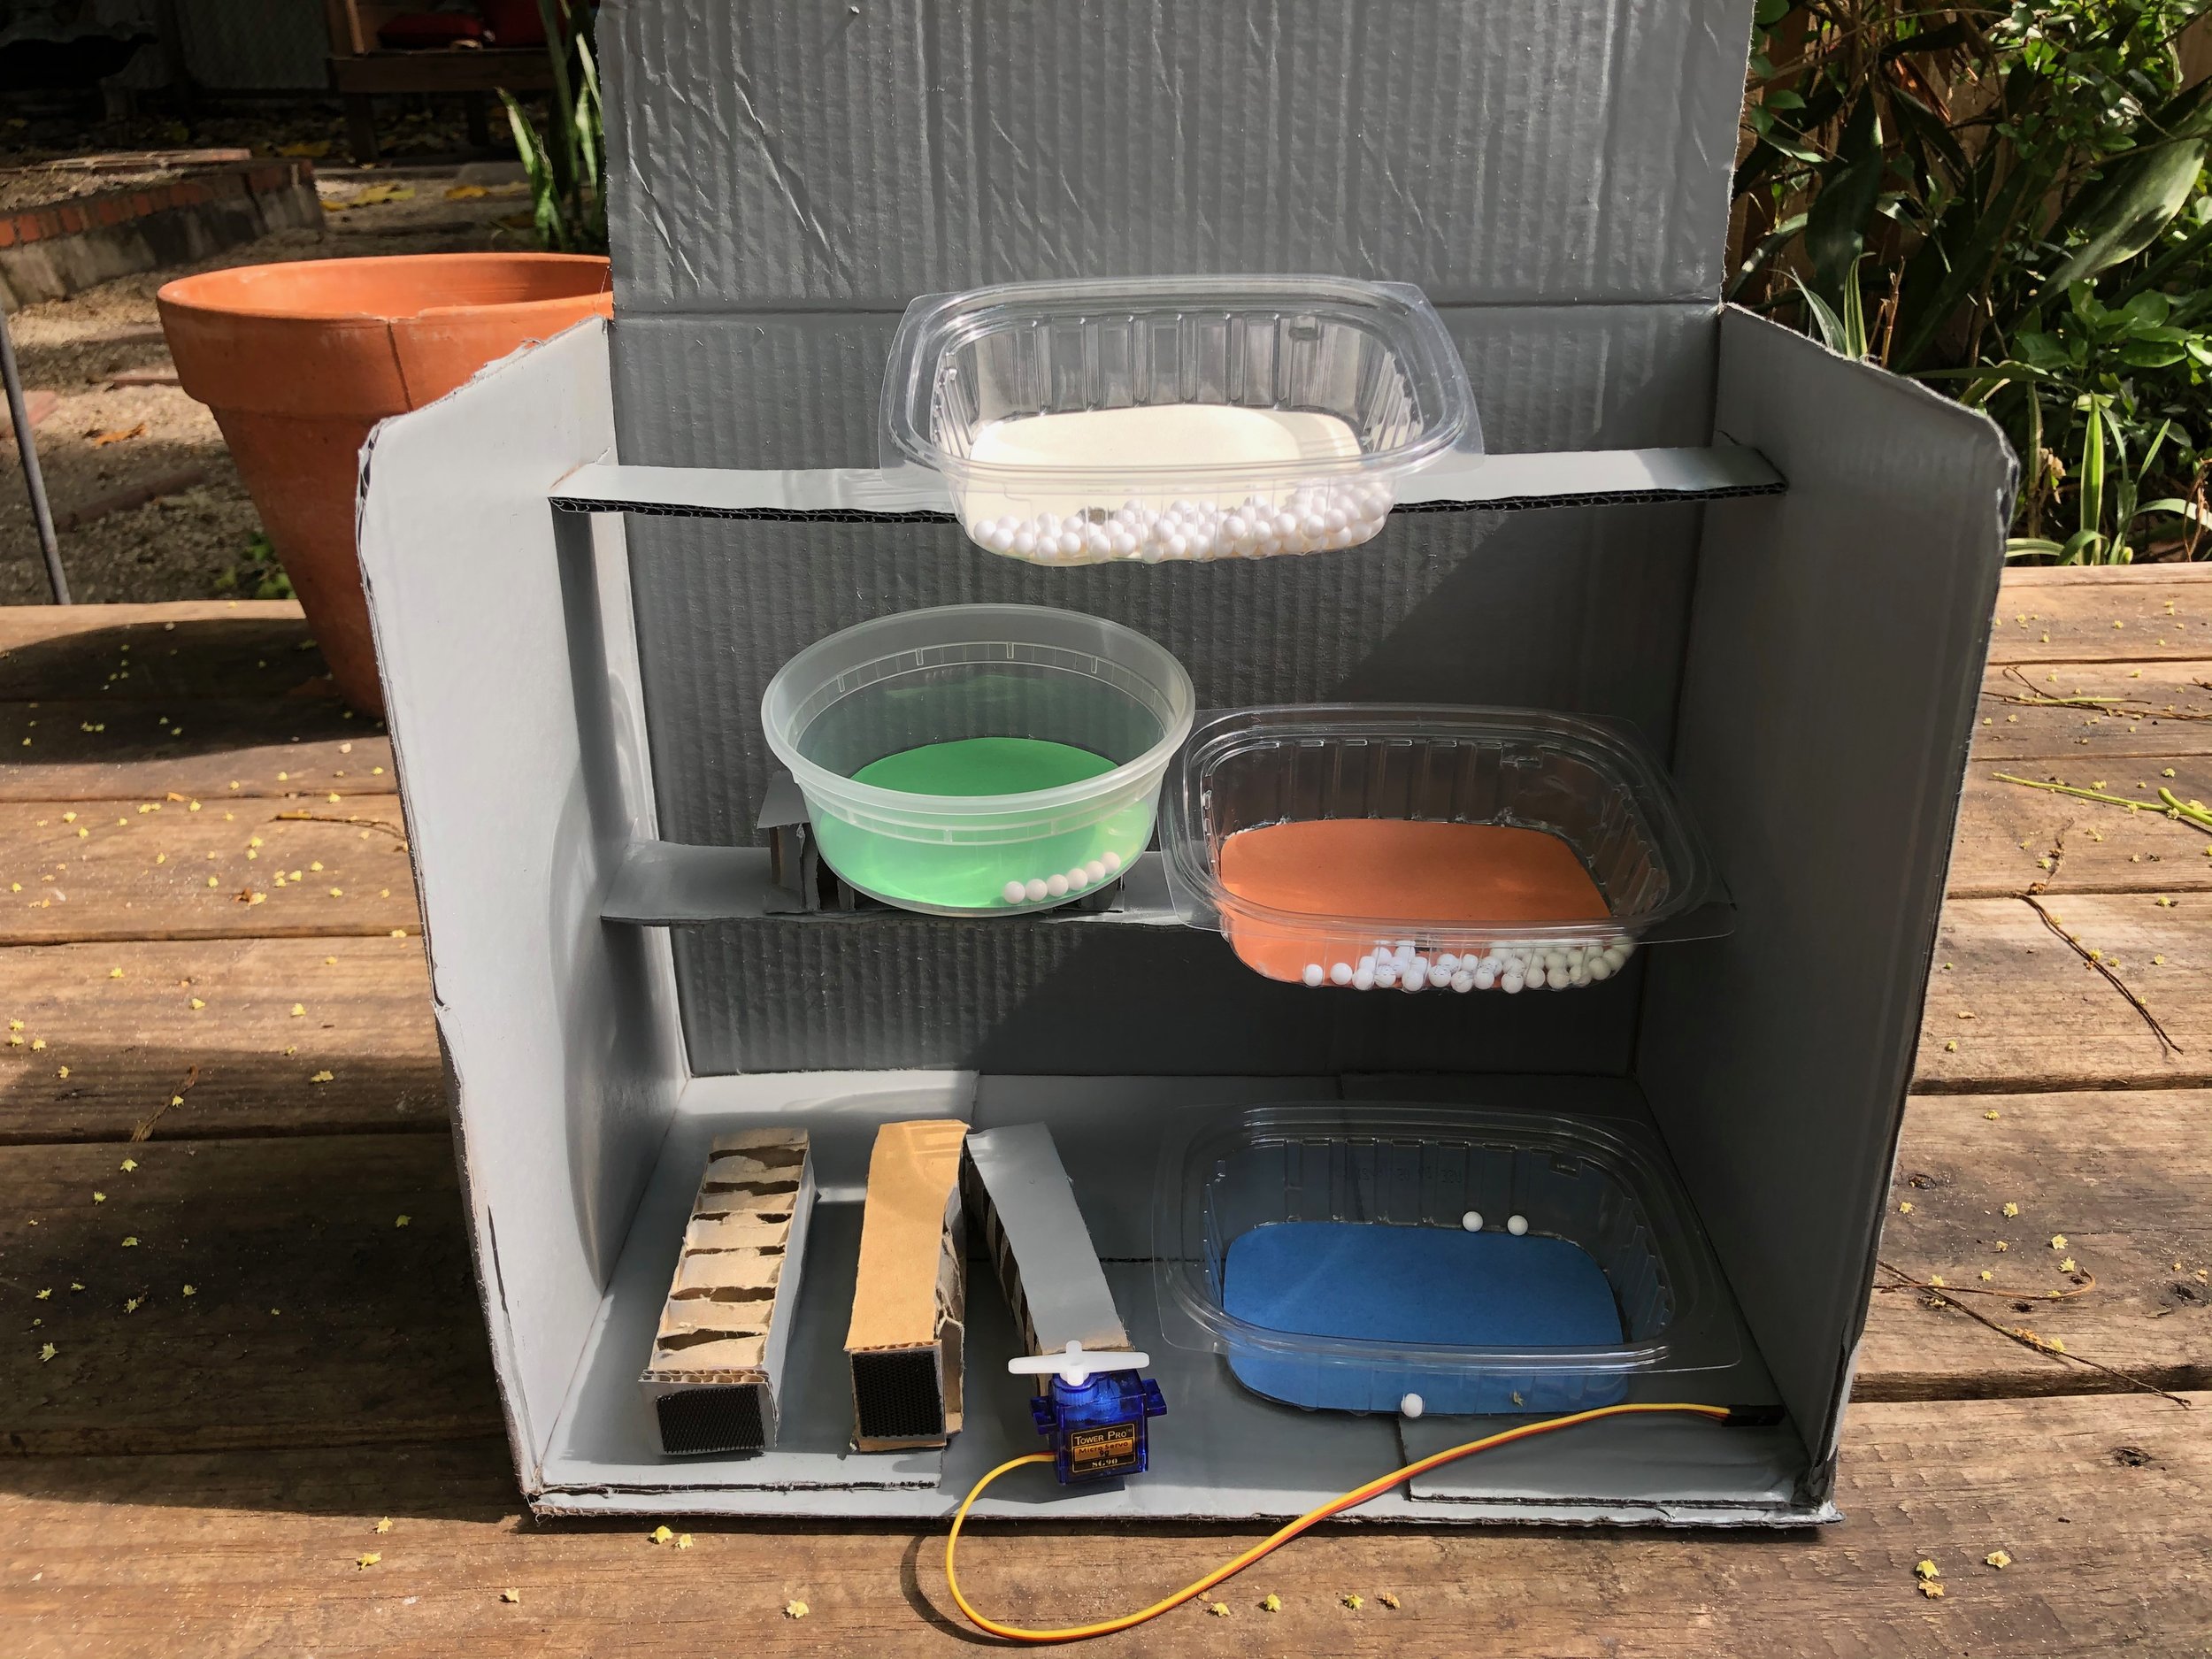
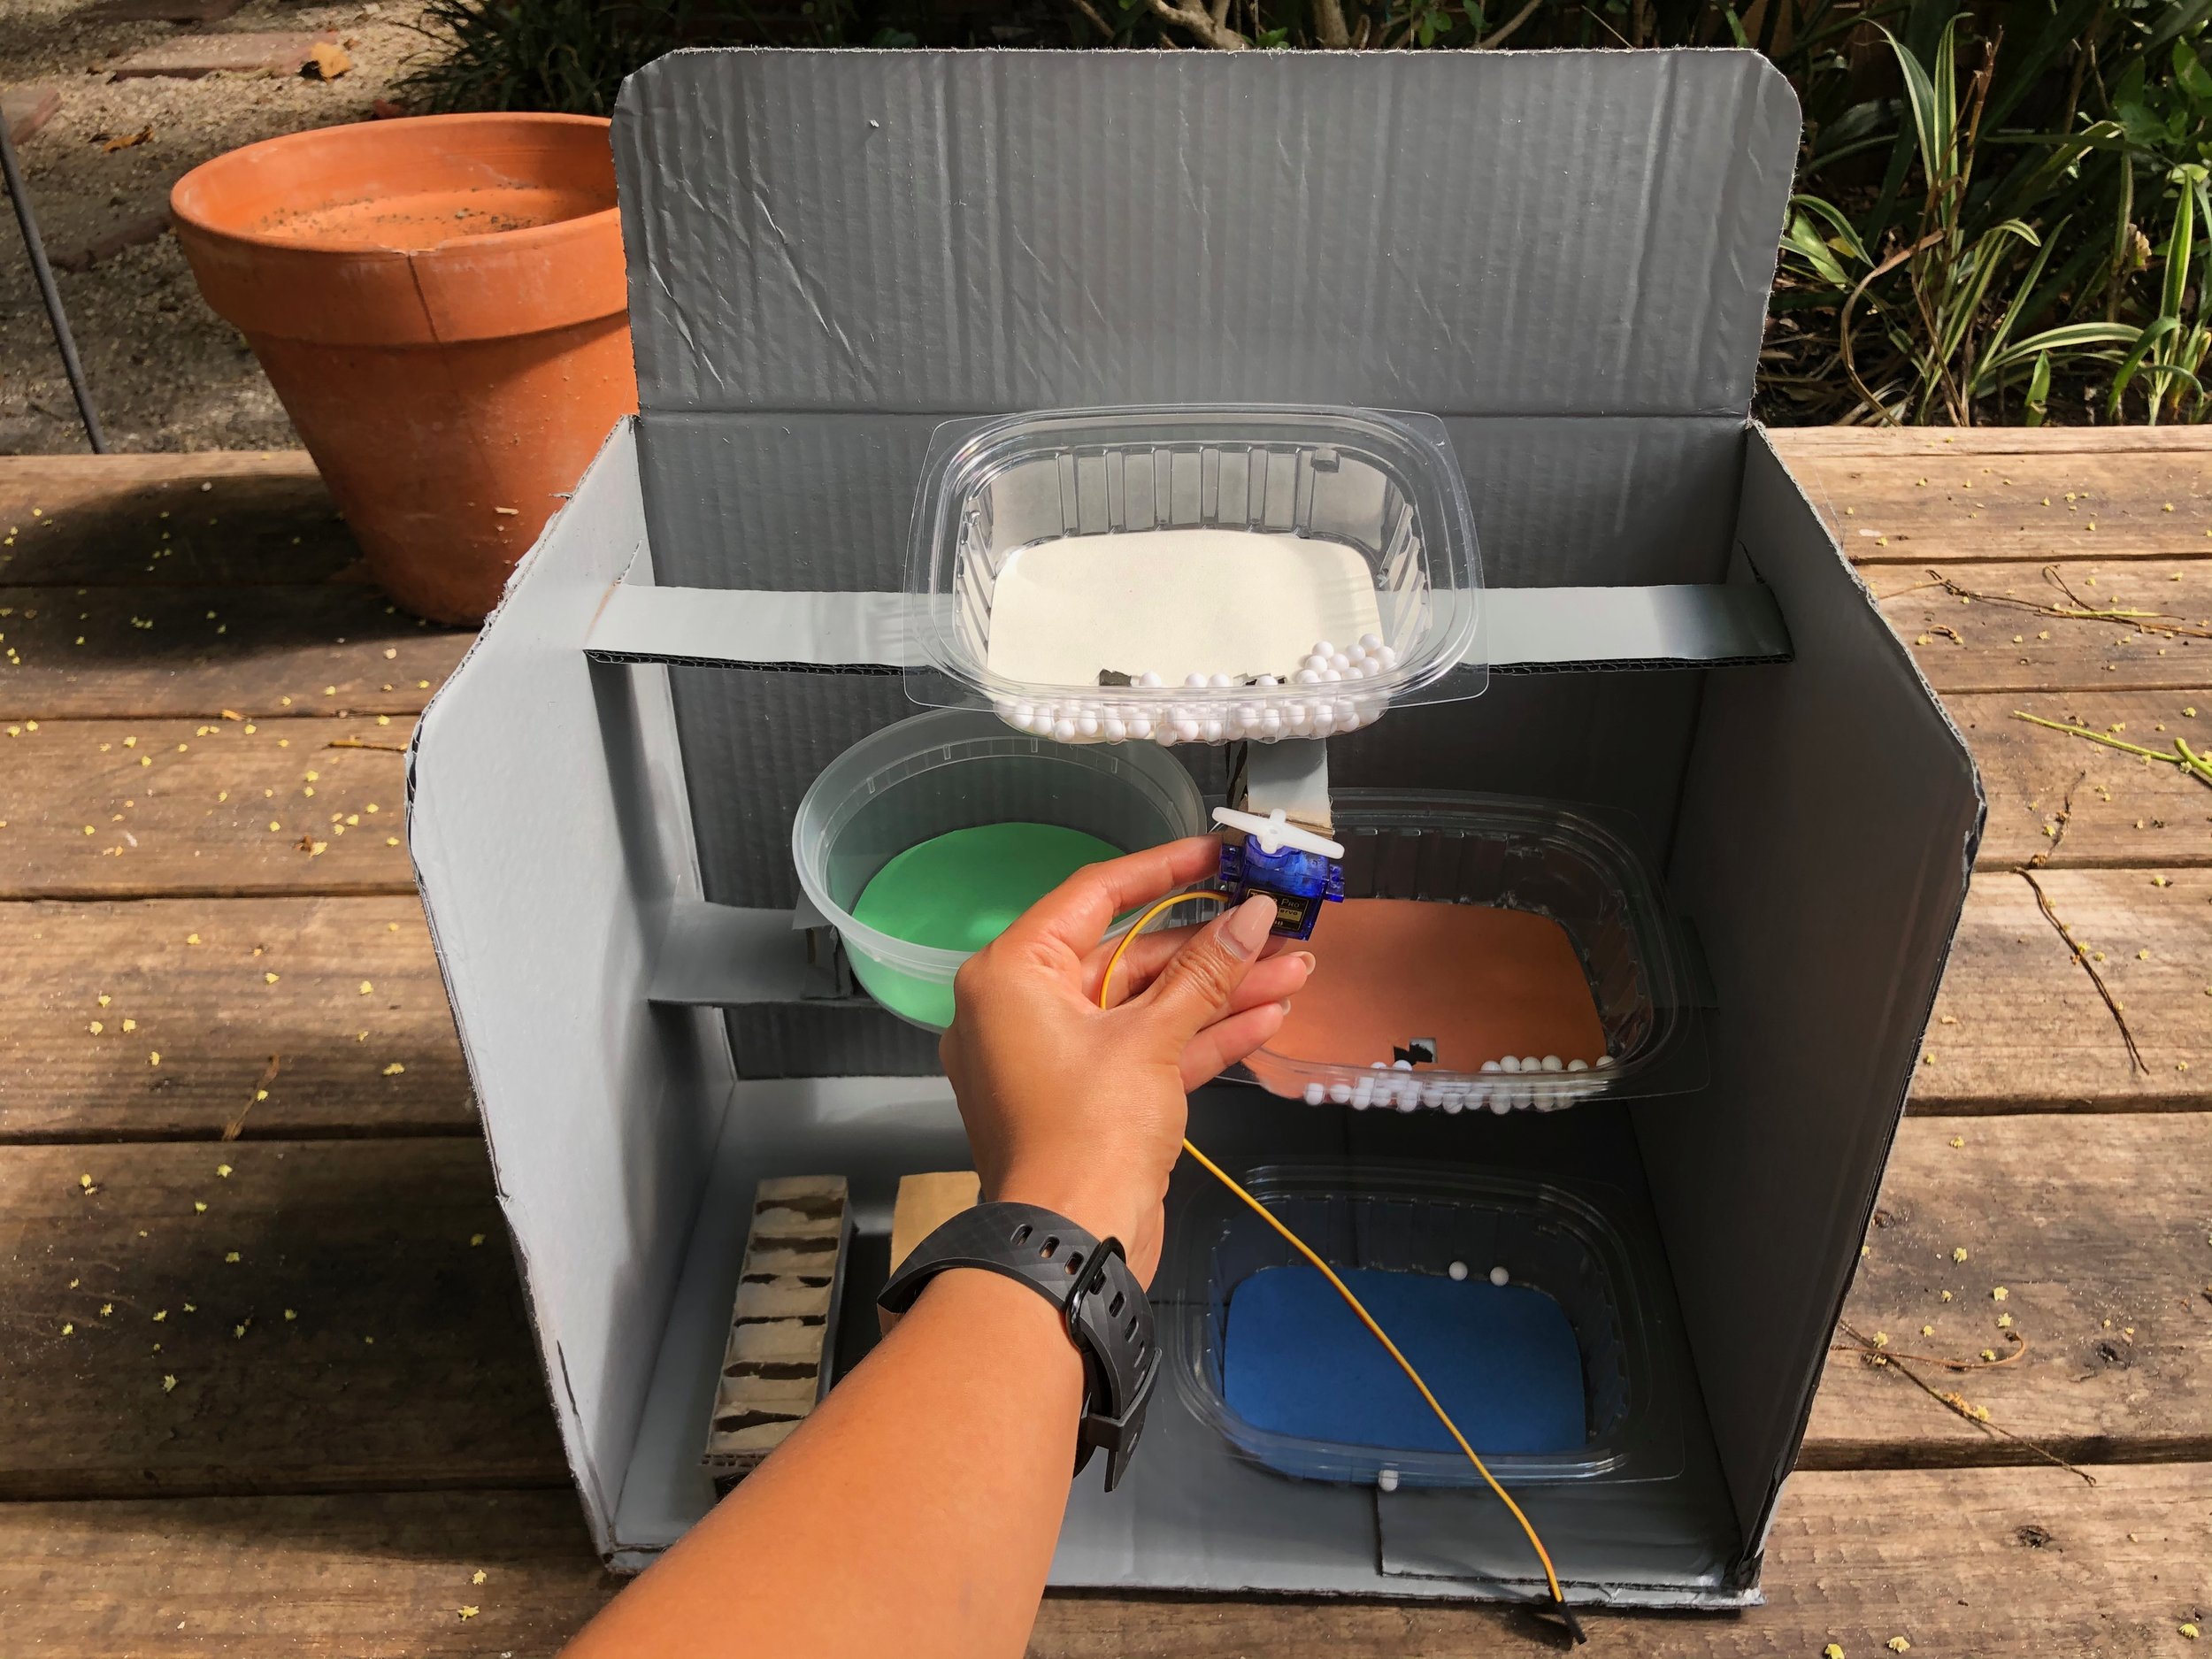
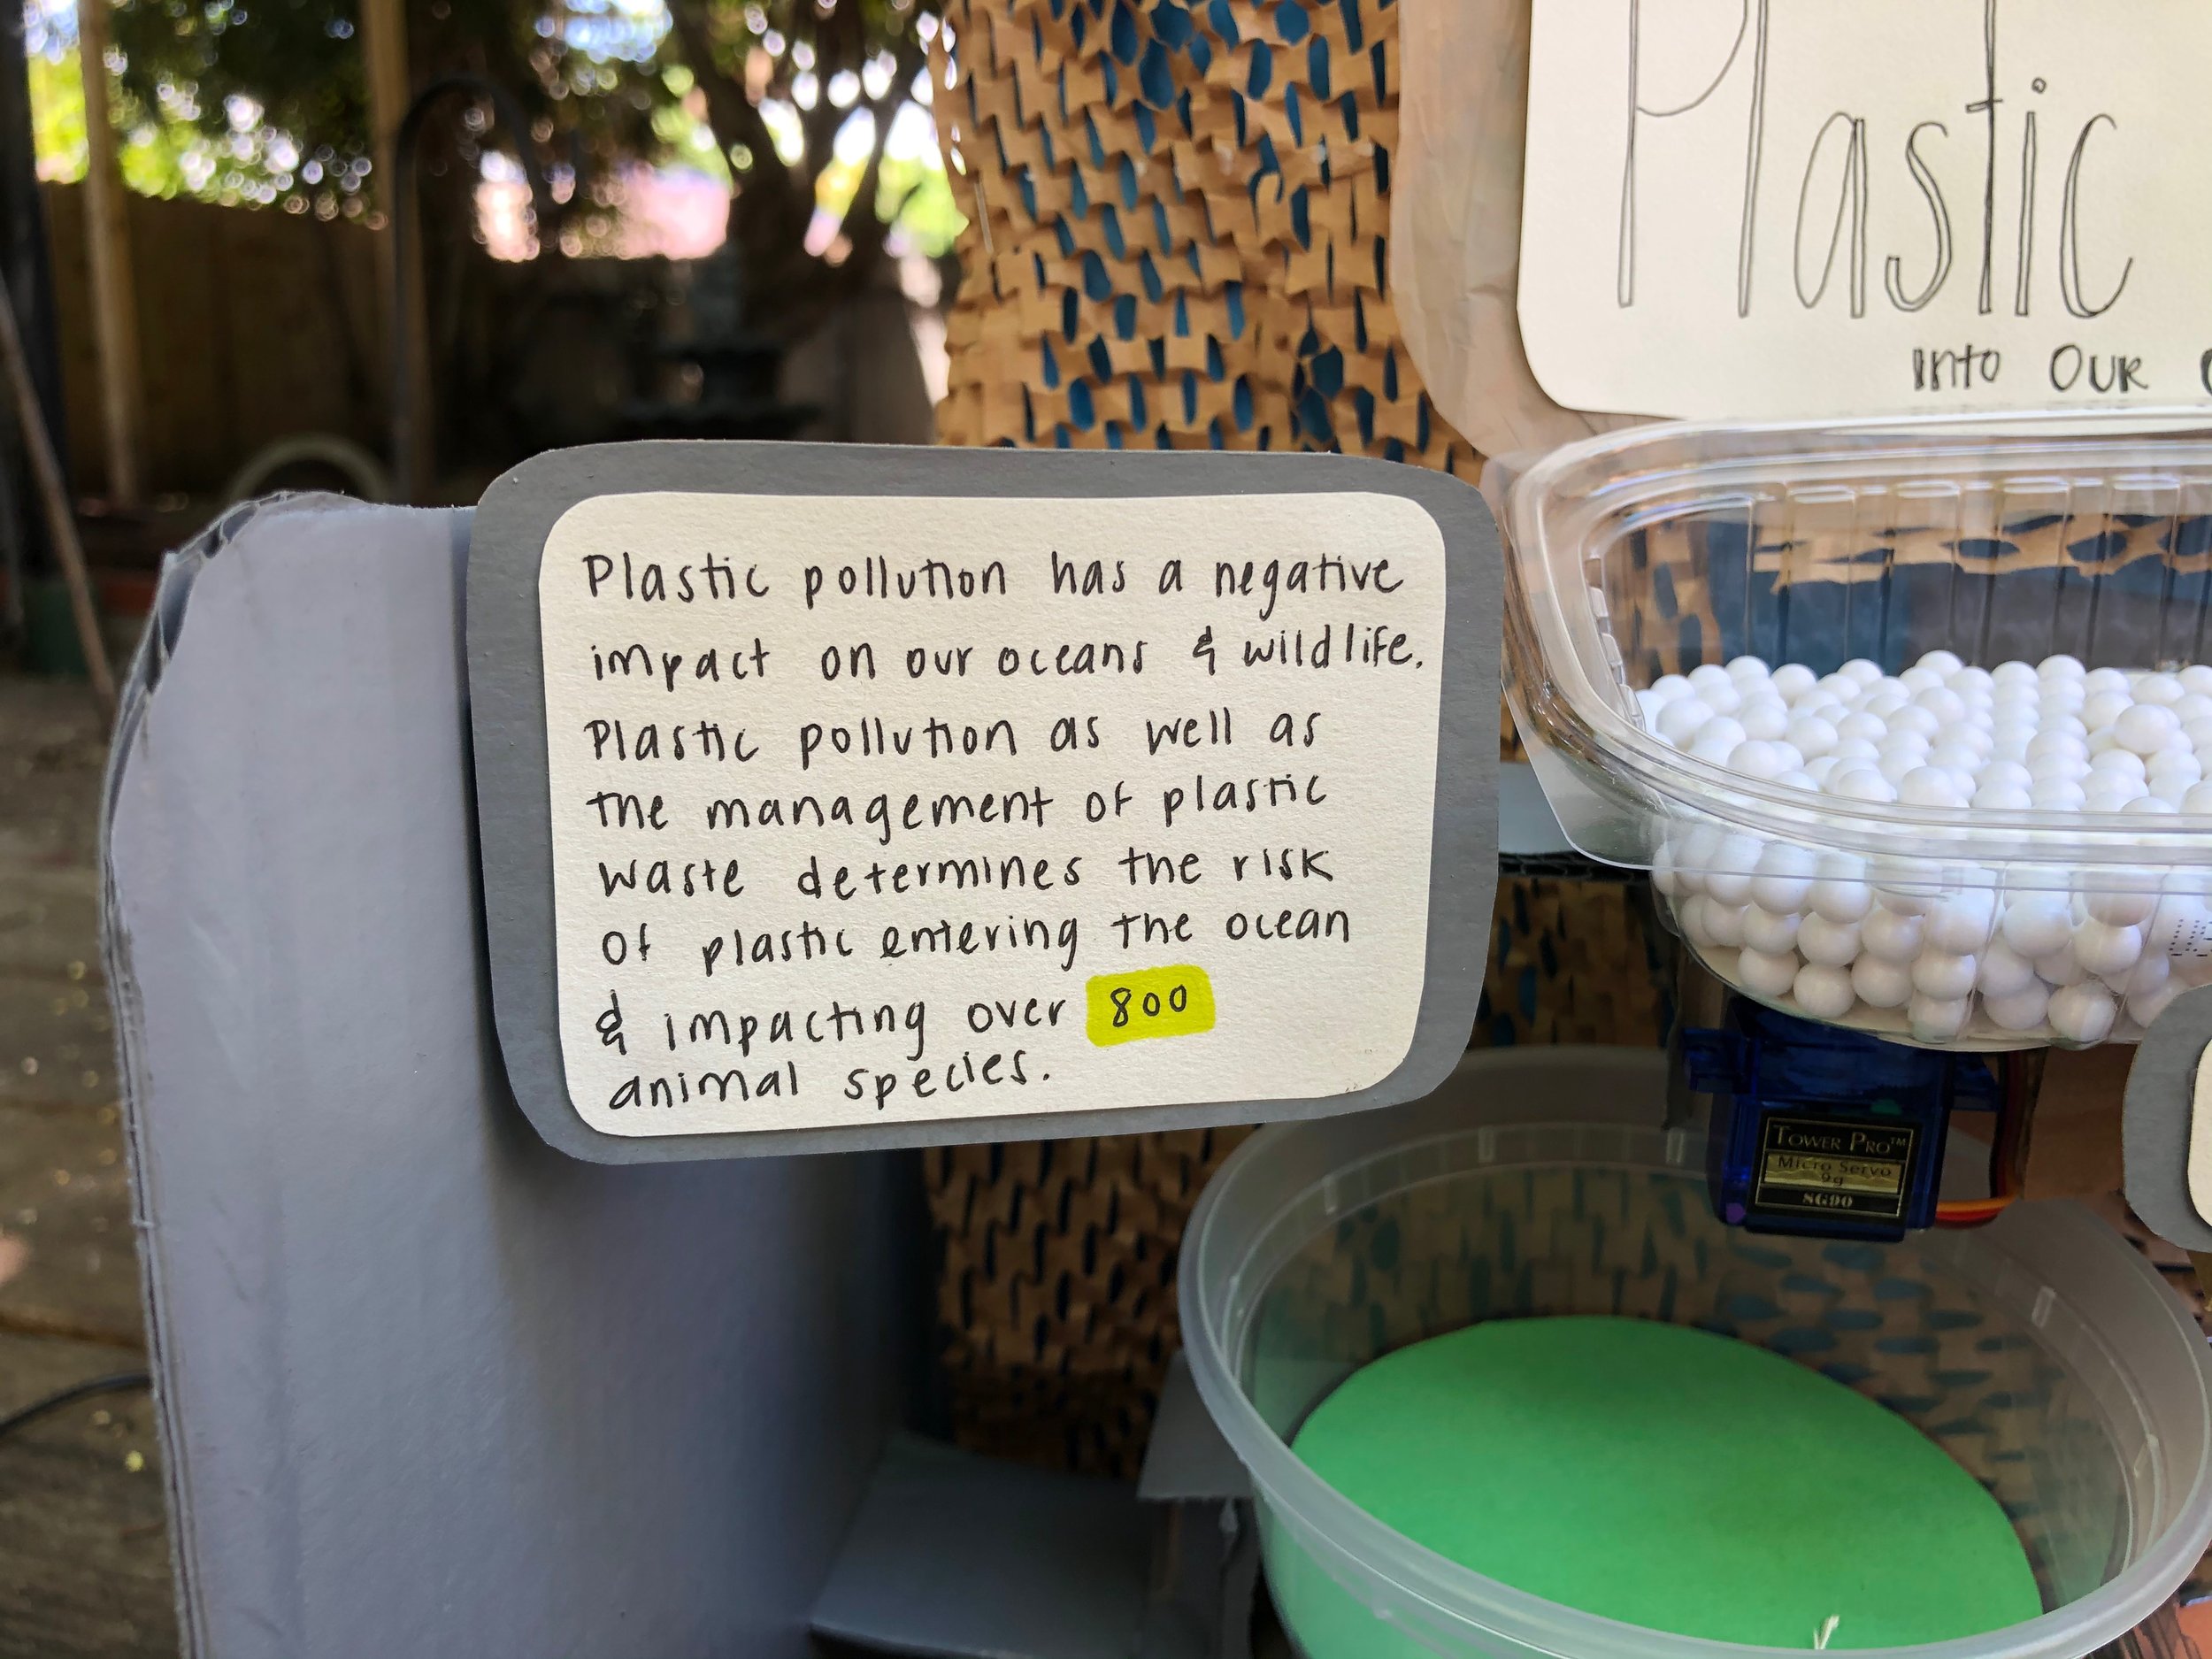
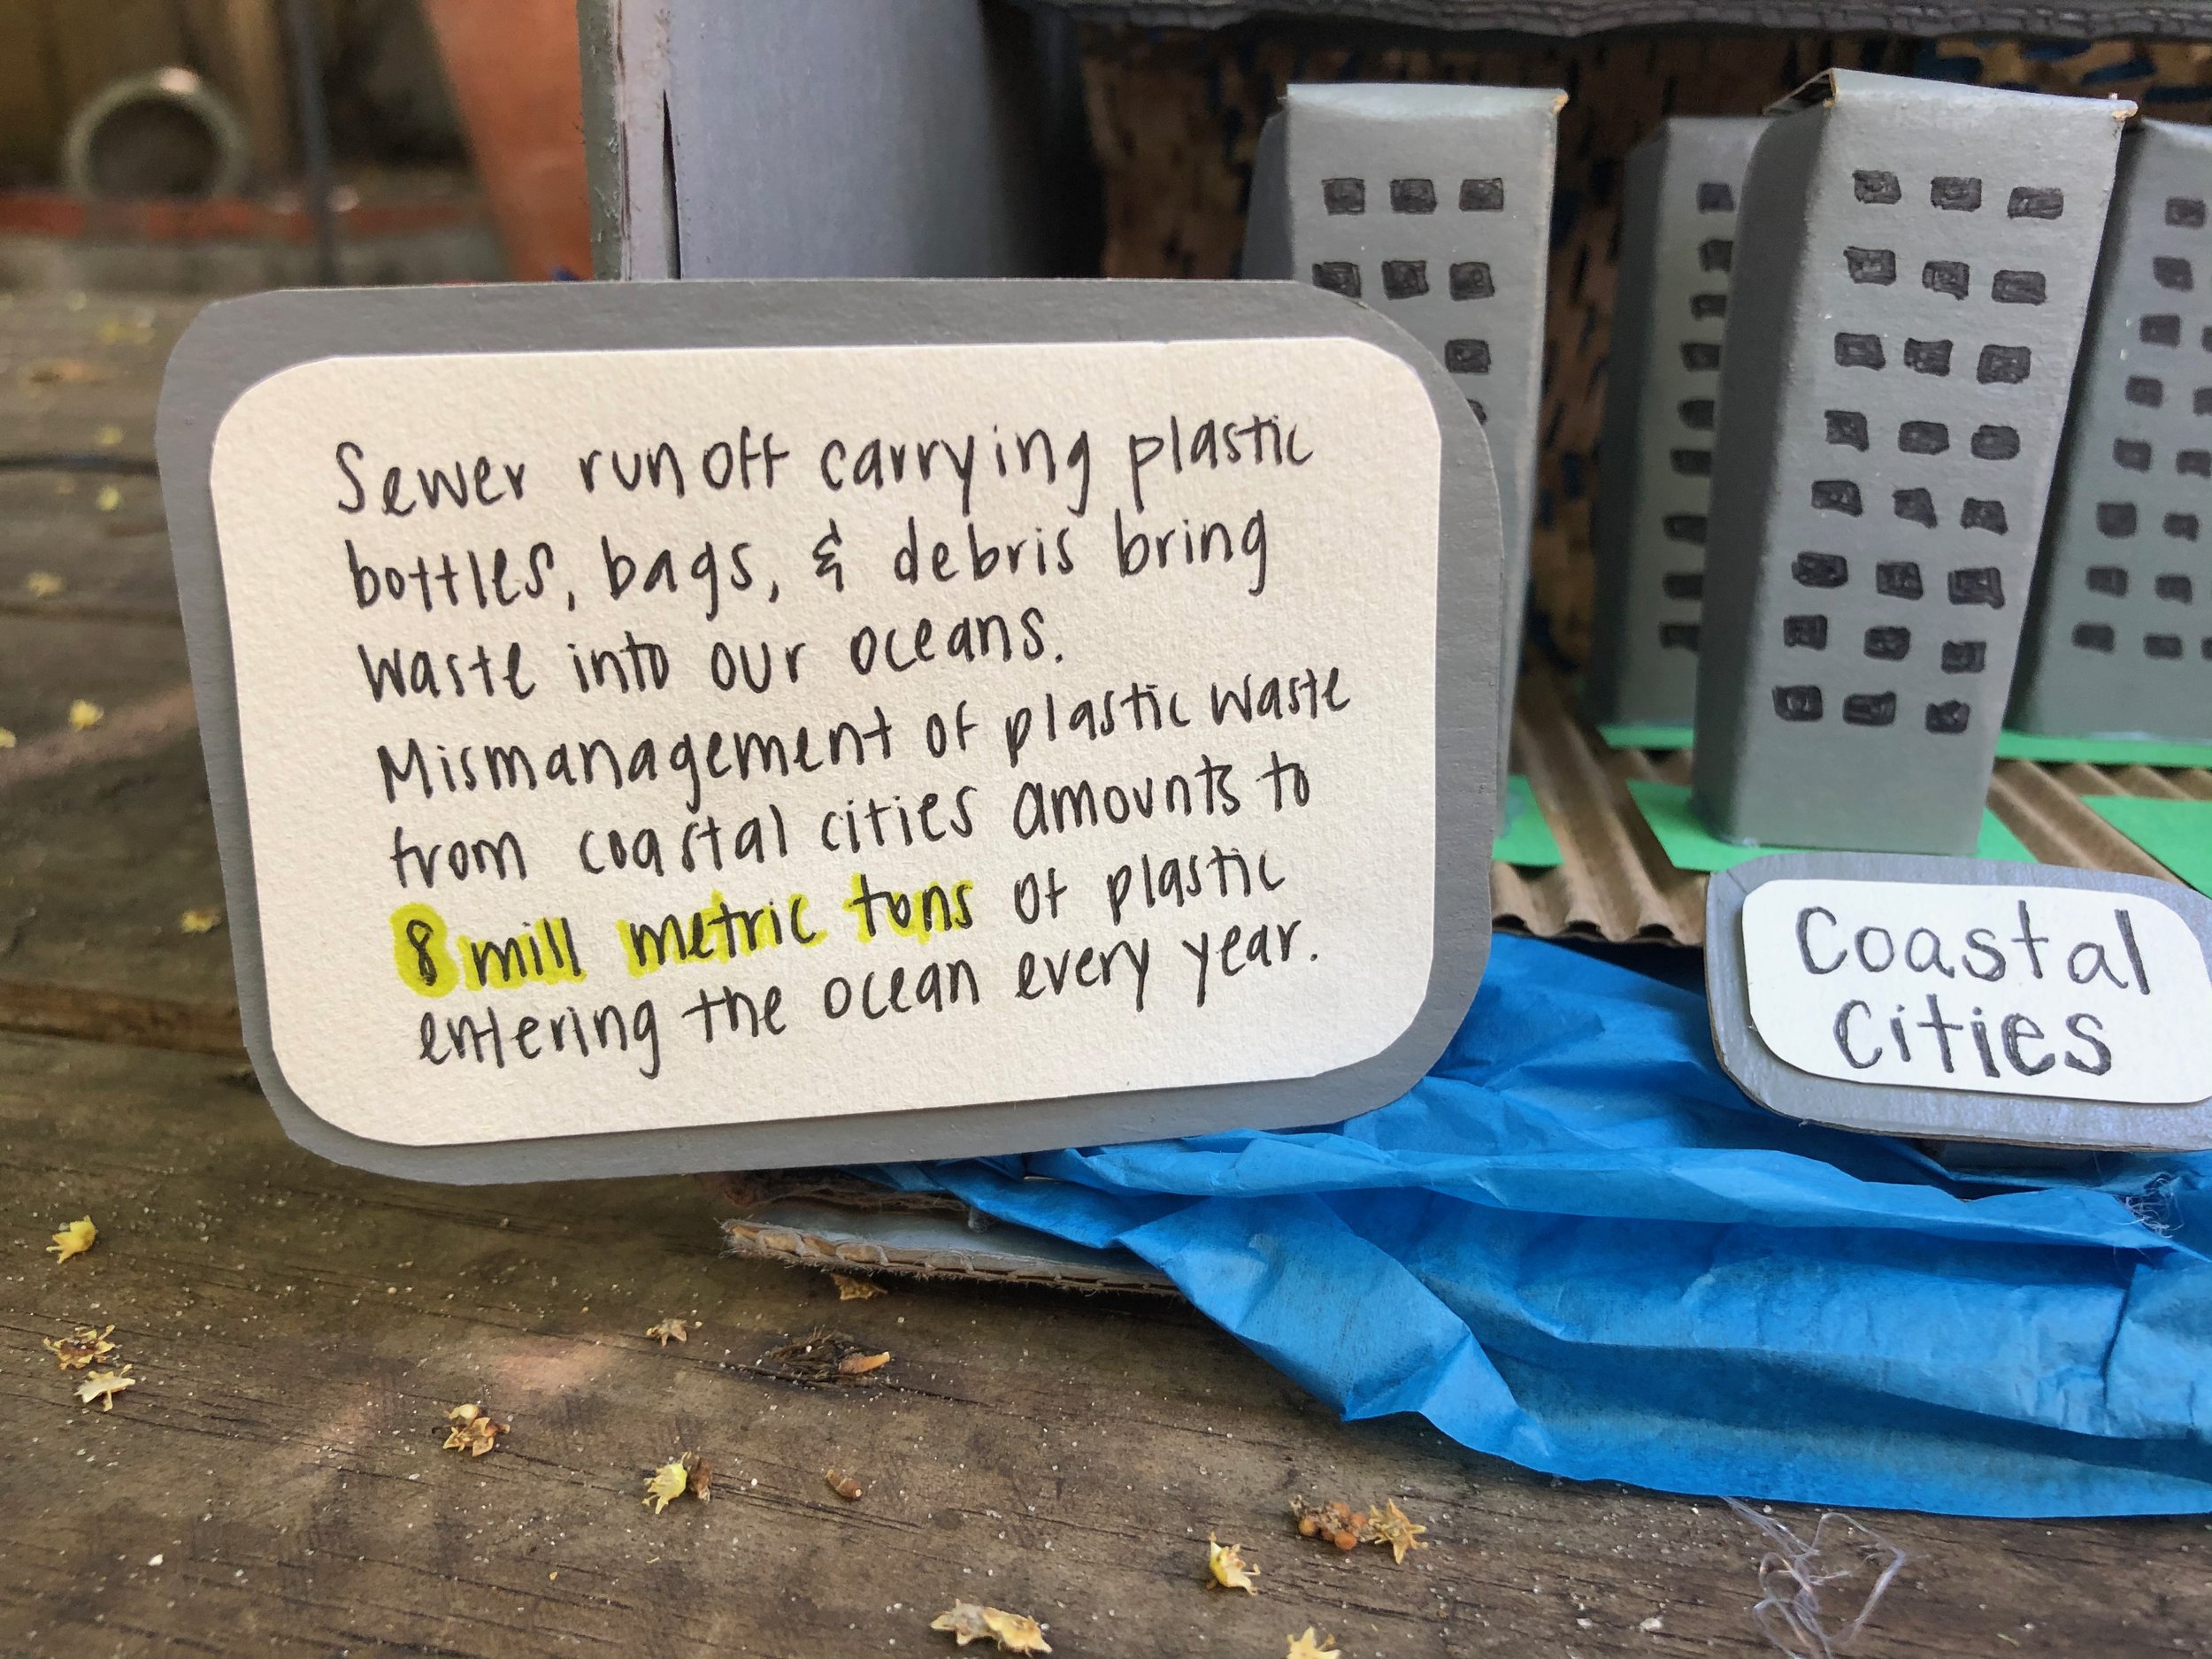
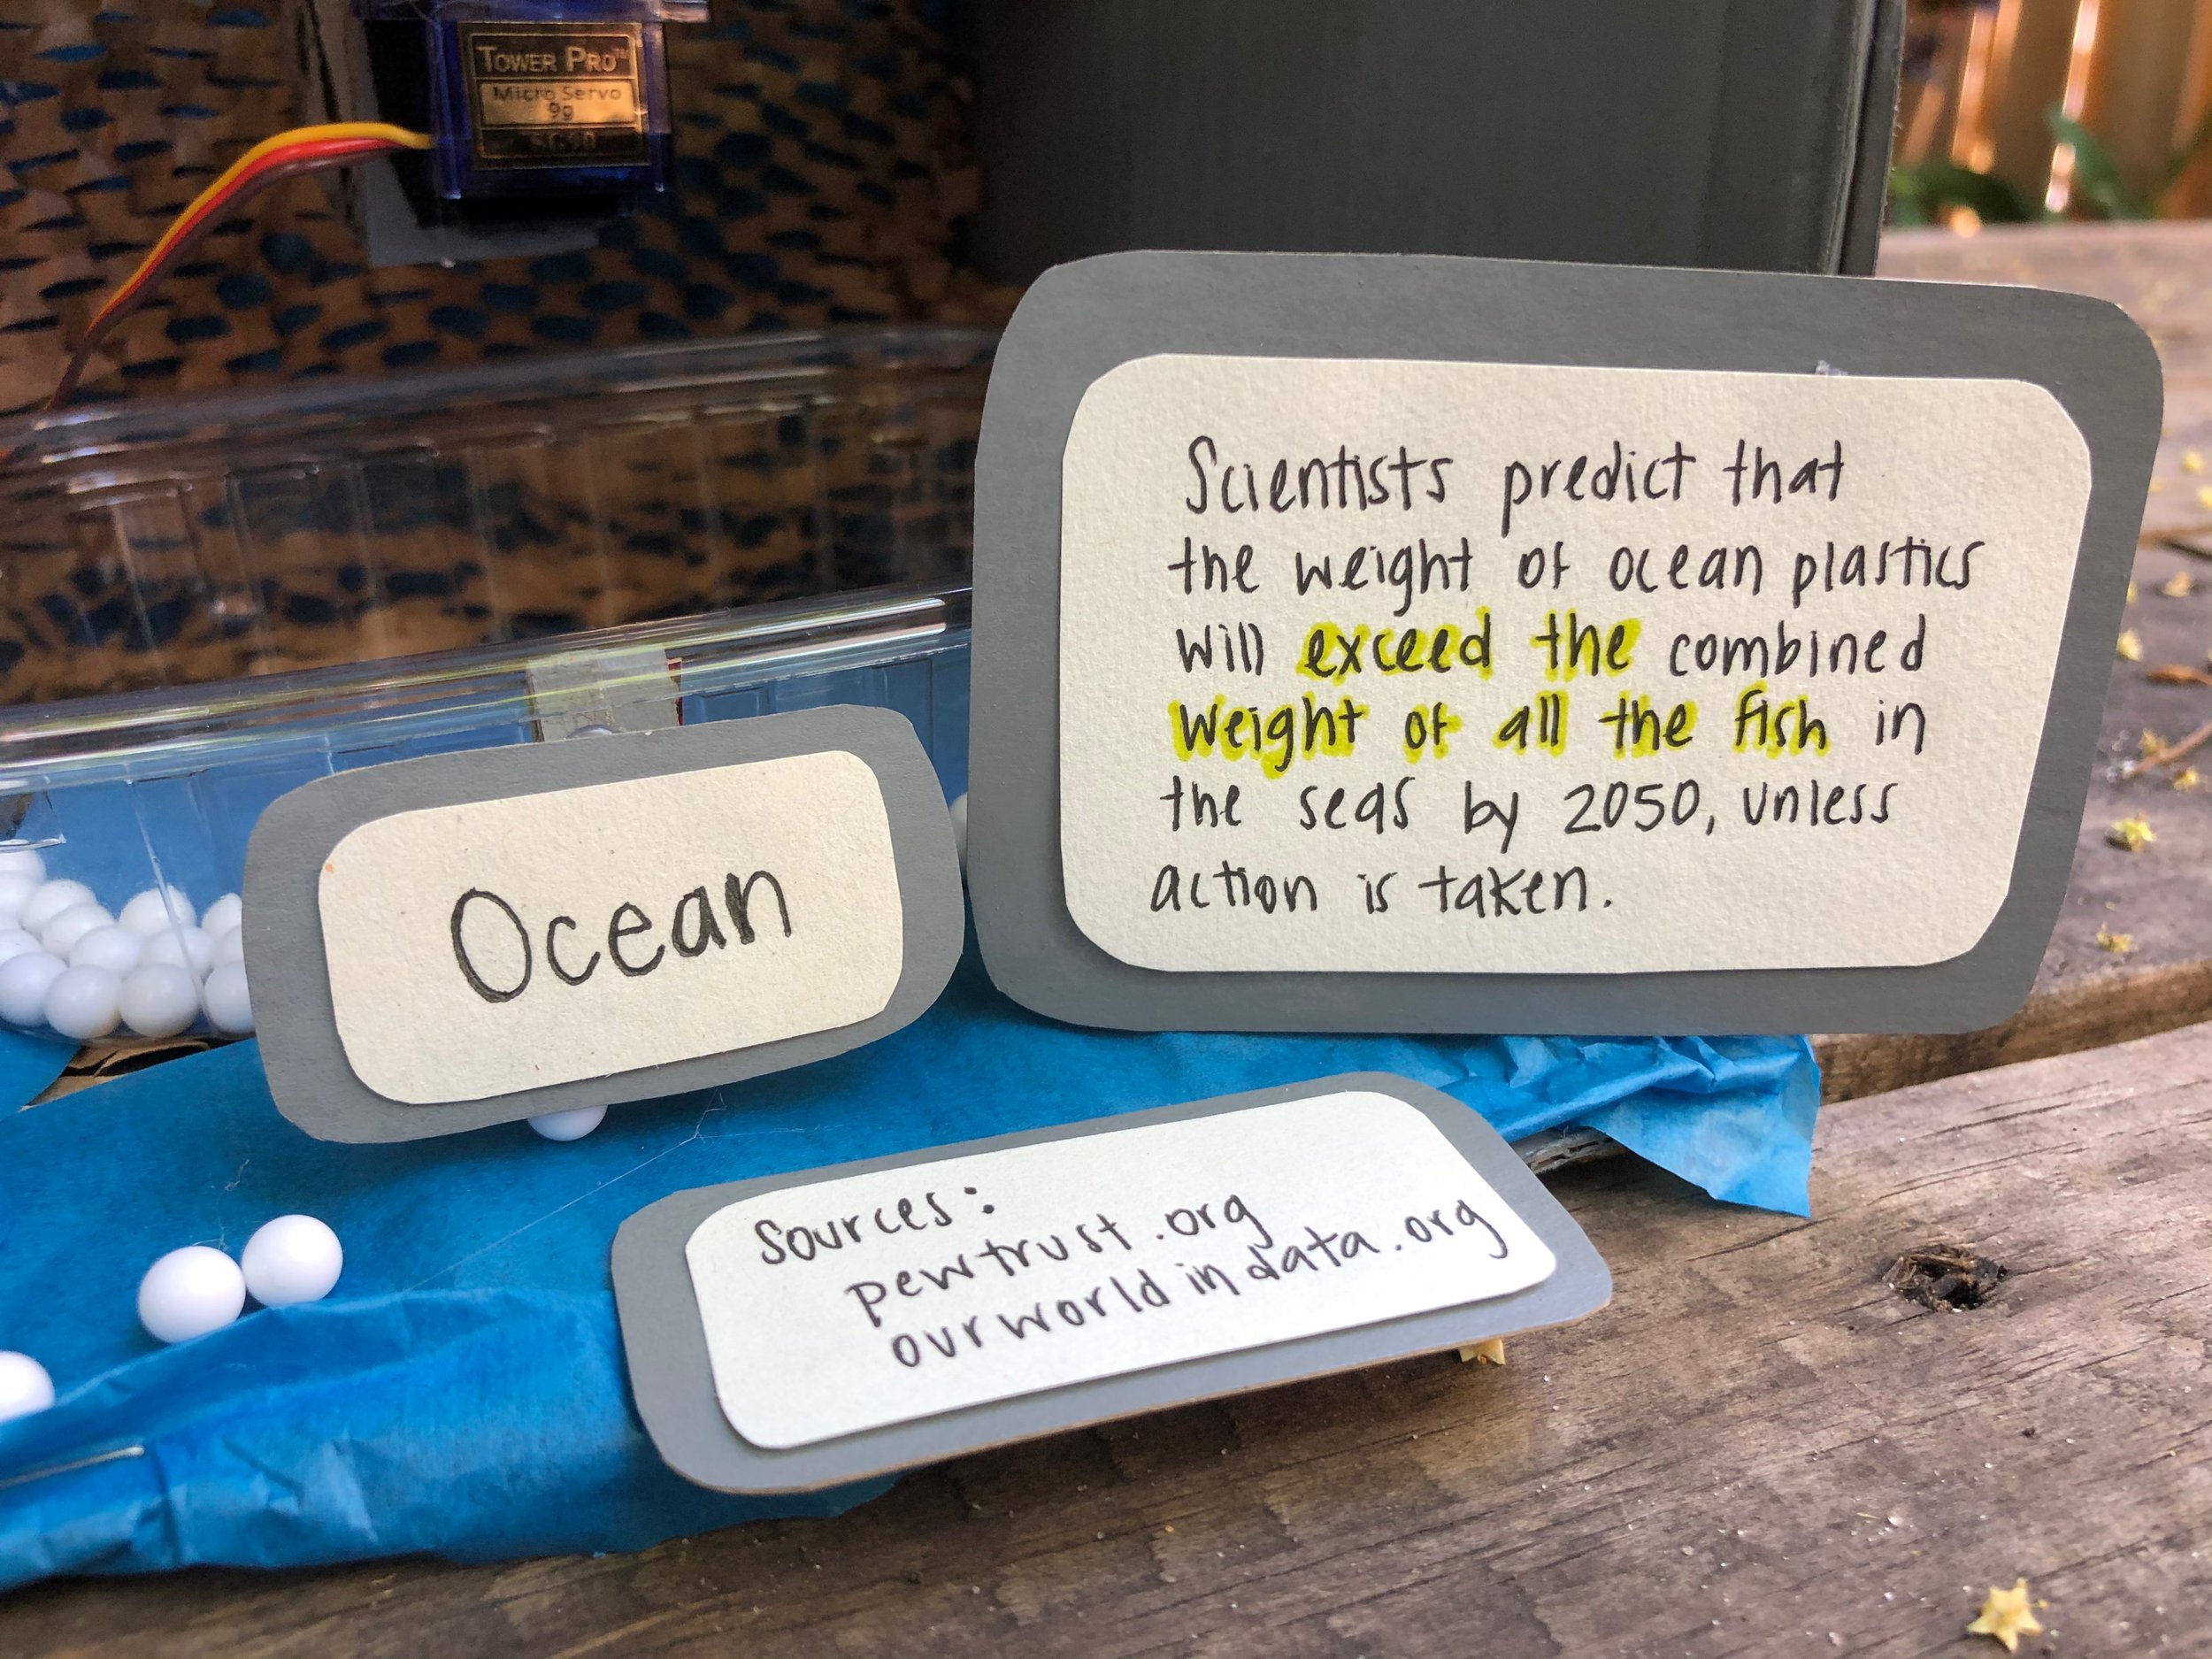
Then using my research and my sources I started to determine what content would go on the viz to help explain the plastic process. I wanted the content to be short and clear and chose facts that could go along with each of the containers — “Plastic Production,” “Recycling,” “Landfill,” and “Ocean.”
I also wanted to emphasize the fact that 8 million metric tons seep into the ocean from coastal cities and so I went to work building a cardboard city next to my “Ocean” container.
PUTTING IT ALL TOGETHER
Labeling each container and providing content for the different components of the project really proved to be key here — I knew the end result would look like a playful infographic, but I wasn’t really sure until the end what the placement would be for each “caption.”
I cut holes in the back of the box to allow for the servo wires to pass through and be able to connect to the microcontroller and the breadboard.
Lastly, here is a video of the viz in operation. It doesn’t work quite as expected, but does get the idea across, that —yes— more plastic does go into the landfill and then trickle into the ocean than it does to recycling. It also can get across that plastic’s path is messy and you never know where your plastic (or plastic pellets in this case) may end up!
REFLECTION
I gained a deep appreciation for how software, hardware and physical materials work together. As I started working on the project, I had a sense that because I was working with found materials that I was cutting myself, the measurements and positioning of the materials had the potential to be imprecise. I attempted to mitigate this by using Velcro to position the plastic containers so that I could move them around.
While this proved useful, I soon realized that the containers’ flat bottoms were not conducive to allowing the white plastic balls to flow to the container underneath it with consistency. A funnel-type shape would have been more appropriate. As I didn’t have the time or materials to construct this, I fidgeted around with the containers to make them tilt forward so that the white balls would collect at a specific part of the container to be more easily able to flow to the next one.
Now, whenever I see any product that has a physical shell and contains both hardware and/or software like a computer mouse or elevator buttons or a car, I have a new deep appreciation for how engineers were able to successfully make all those components fit together while also providing a comfortable experience for the user.


